Help students understand data collection and organization with this lesson. They’ll learn how to create tally charts, organize data into tables, and interpret the results to draw meaningful conclusions.
By the end of this unit, students will be able to:
Understand the concept of data and how it can be collected and organized.
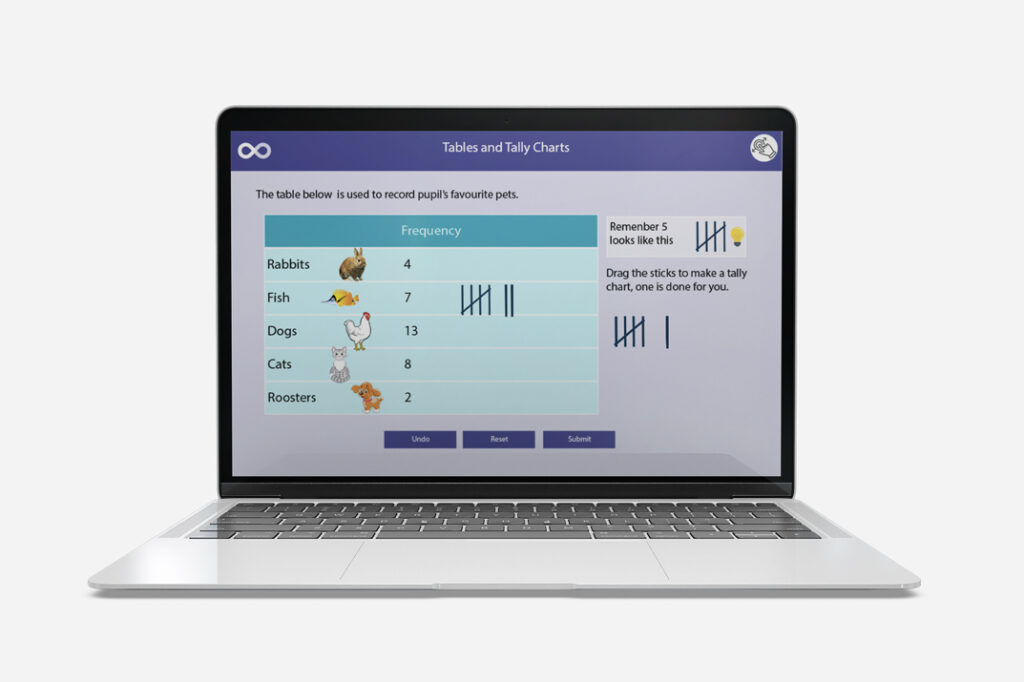
Create and use tally charts to collect data on categorical variables.
Organize data from tally charts into tables.
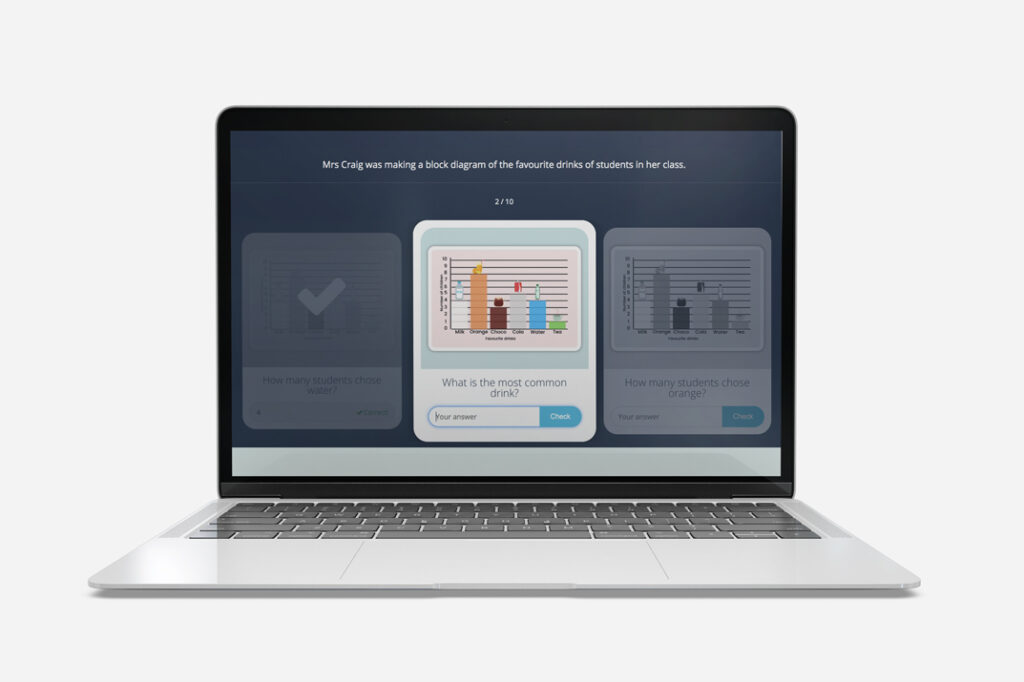
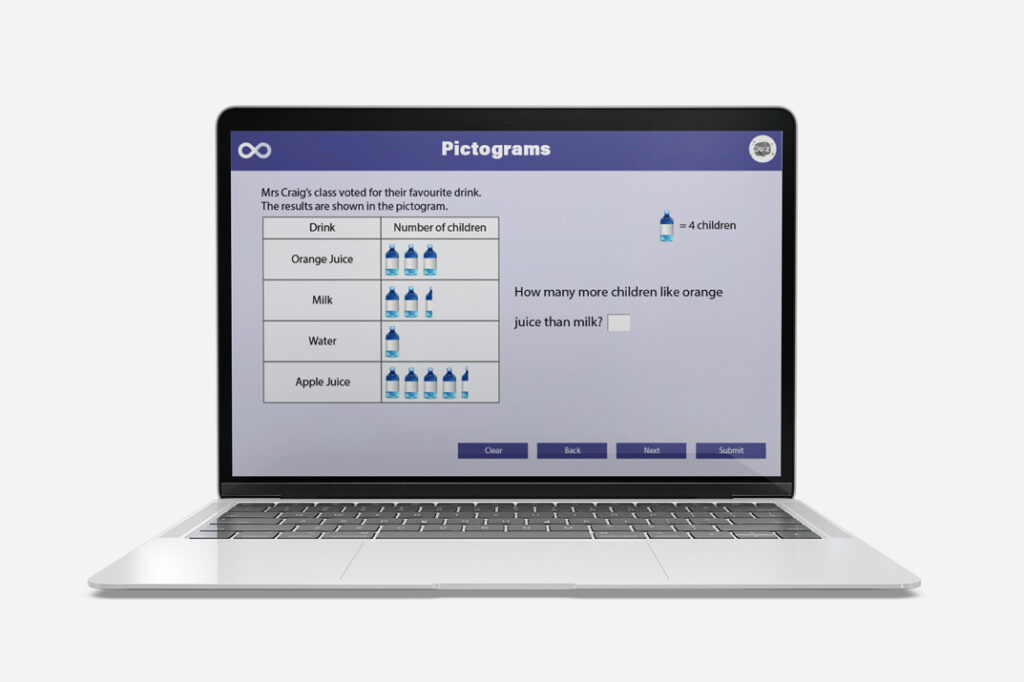
Interpret and draw conclusions from data represented in tally charts and tables.
National Curriculum Objectives
Year 3 Statistics:
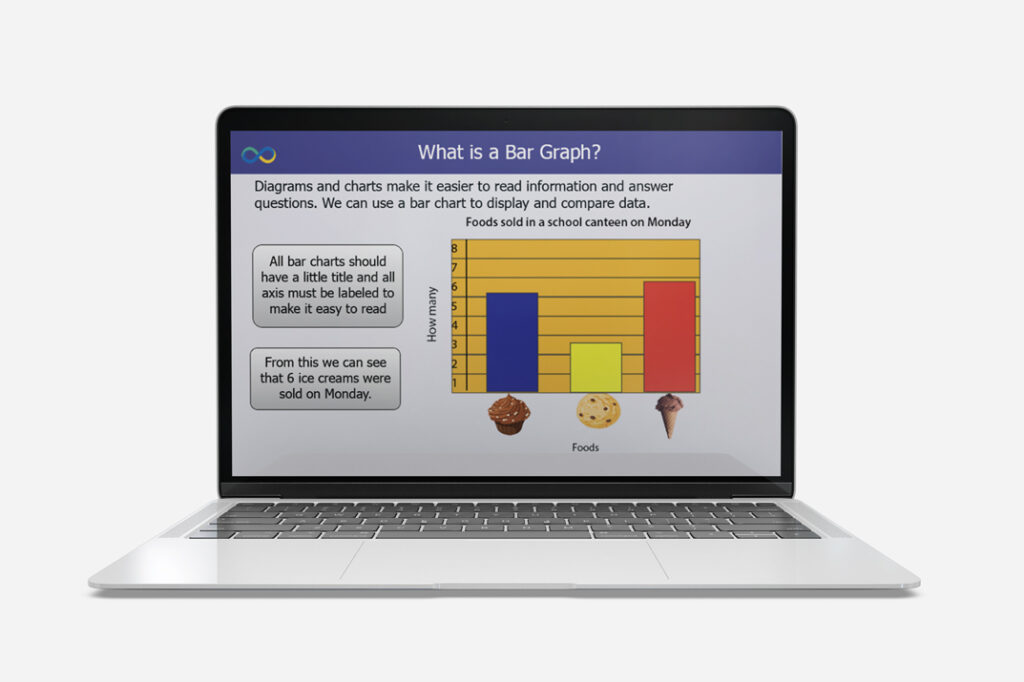
Interpret and present data using bar charts, pictograms and tables.
Solve one-step and two-step questions [for example ‘How many more?’ and ‘How many fewer?’] using information presented in scaled bar charts and pictograms and tables.