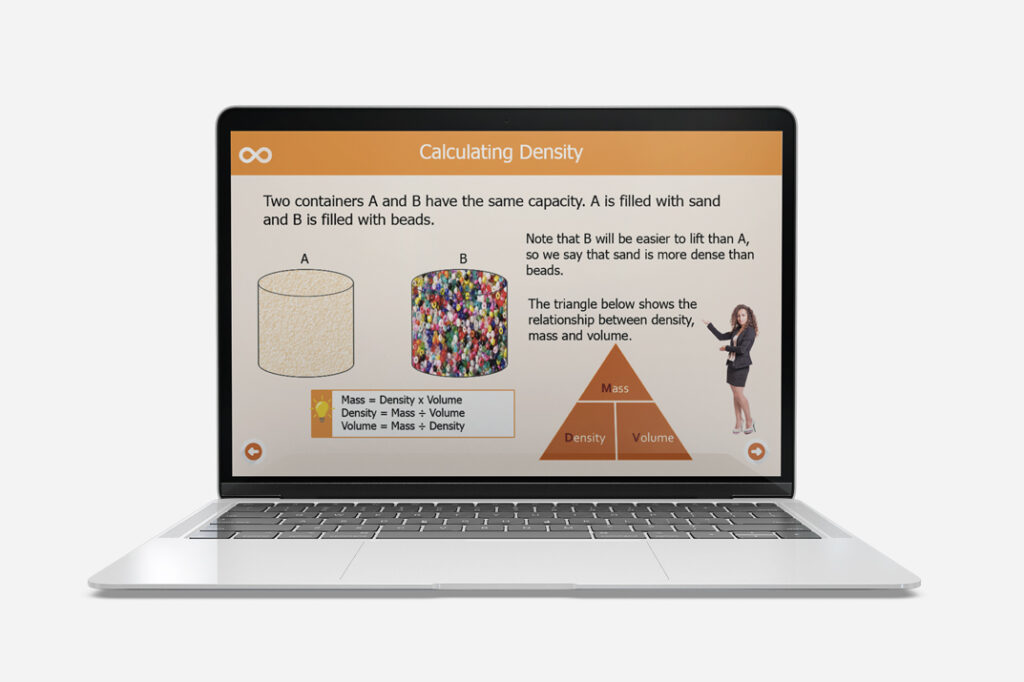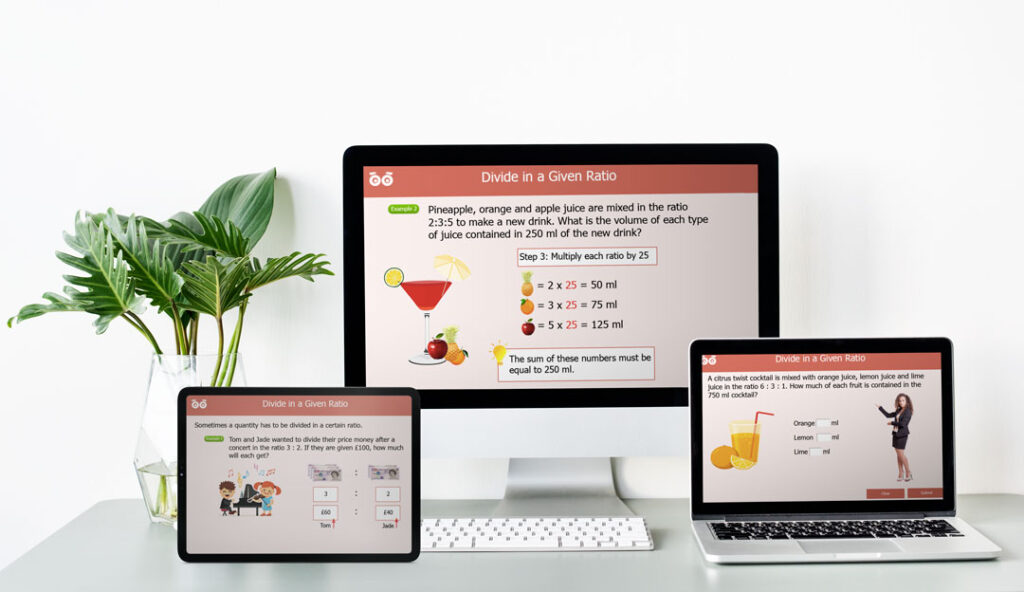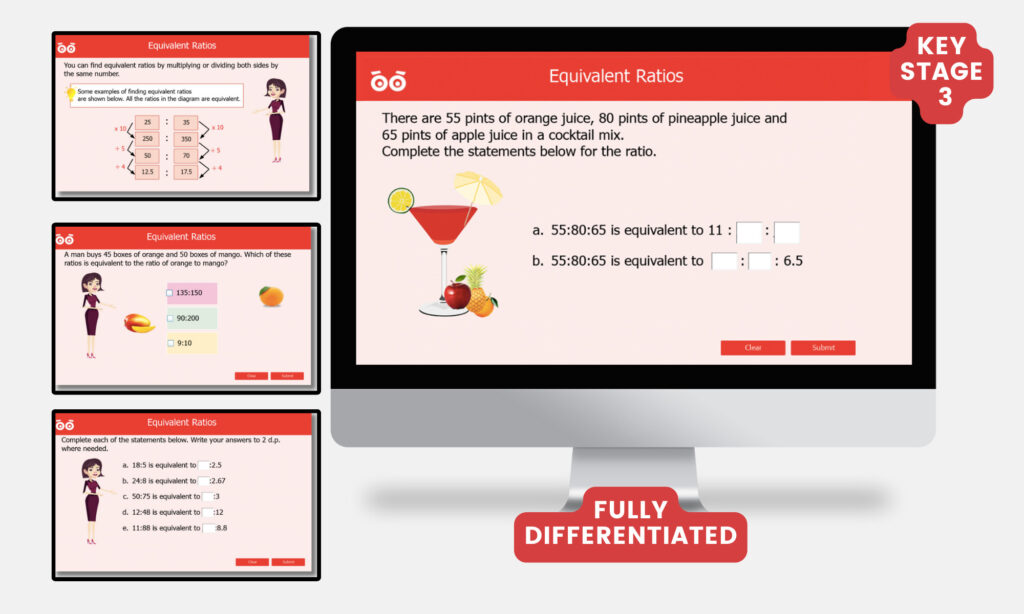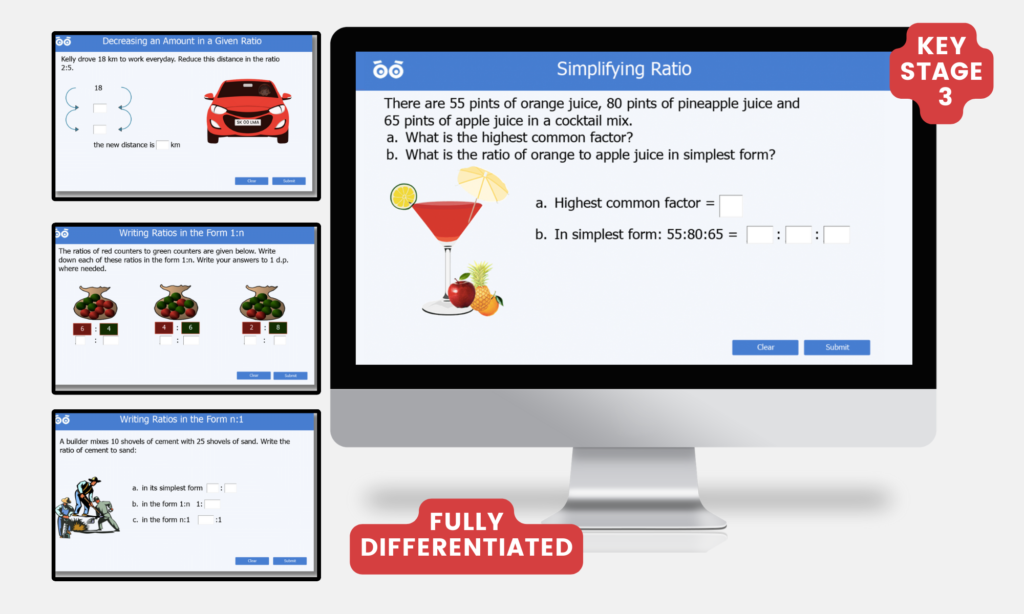
Description
By the end of this unit, students will:
- Understand the concept of conversion between different units of measurement.
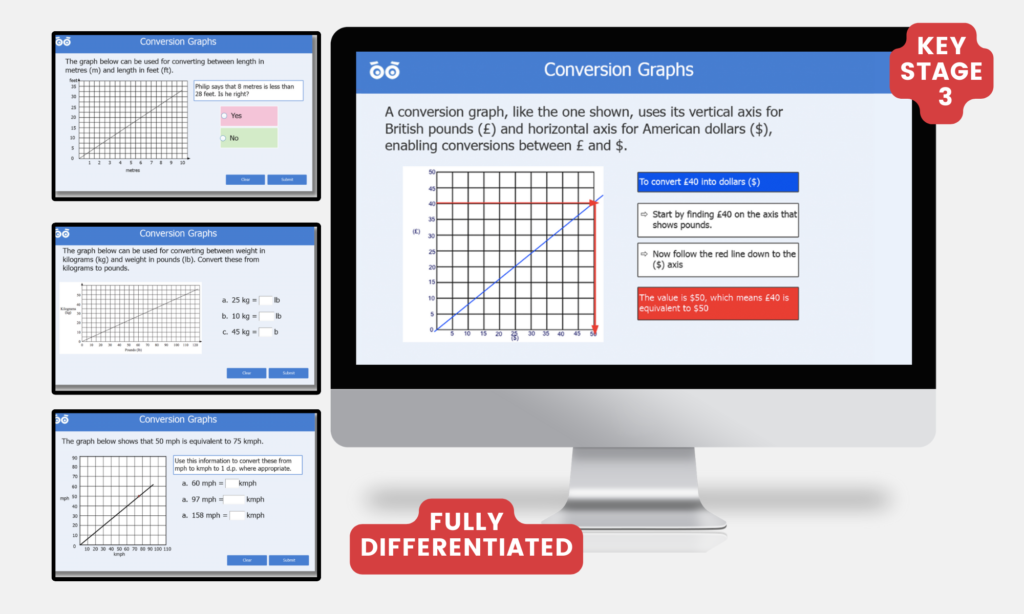
- Interpret conversion graphs and extract relevant information.
- Use conversion graphs to convert between units of measurement.
- Apply the concept of conversion graphs to real-life and mathematical problems.
Links to Curriculum
Key Stage 3: Ratio, proportion and rates of change
- change freely between related standard units [for example time, length, area, volume/capacity, mass]
Target Ages
- Age: 11-14
- England & Wales: Year 7-9
- Scotland: S1-S3
- Rep. Ireland: 6th Class-2nd Year
- Australia: Grade 6-8
- USA: Grade 6-8
What's Included
- Three-part Lesson
- Self-marking Activities
- Fluency, Reasoning and Problem-solving Questions.
- Engaging Drag and Drop Activities
- Interactive Self-marking Worksheet
- Printable Worksheets to Consolidate Learning
Connected Resources
Trusted by Educators and Loved by Students Worldwide
Right for my child, the 4th option we've used this year, and my daughter is learning well!

I've used Skoolmaths for 6 months. Engaging, easy to use, and perfect for extra practice. My son loves it!

Skoolmaths offers everything for my classrooms, including engaging digital activities and printable worksheets.

Since subscribing to Skoolmaths, my children have improved greatly with engaging and effective interactive learning materials.

I use the resources primarily for students with learning difficulties, and on the autism spectrum for extra practice and during independent centers.

Choose Your Plan
Maths and Science
£
7
Monthly
99
Monthly
- Access to all subjects
- Downloadable resources
- Progress tracking for one user
Best Value
Maths
£
4
Monthly
99
Monthly
- Access to all Maths Content
- Downloadable resources
- Progress tracking for one user
Science
£
4
Monthly
99
Monthly
- Access to all Science Content
- Downloadable resources
- Progress tracking for one user
Maths and Science
£
12
Monthly
99
Monthly
- Access for multiple users
- Access to all subjects
- Downloadable resources
- Progress tracking for all users
Best Value
Maths
£
7
Monthly
99
Monthly
- Access for multiple users
- Access to all Maths Content
- Downloadable resources
- Progress tracking for all users
Science
£
7
Monthly
99
Monthly
- Access for multiple users
- Access to all Science Content
- Downloadable resources
- Progress tracking for all users
