One-time purchase. Instant digital download.
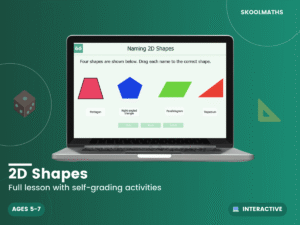
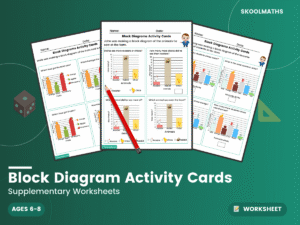
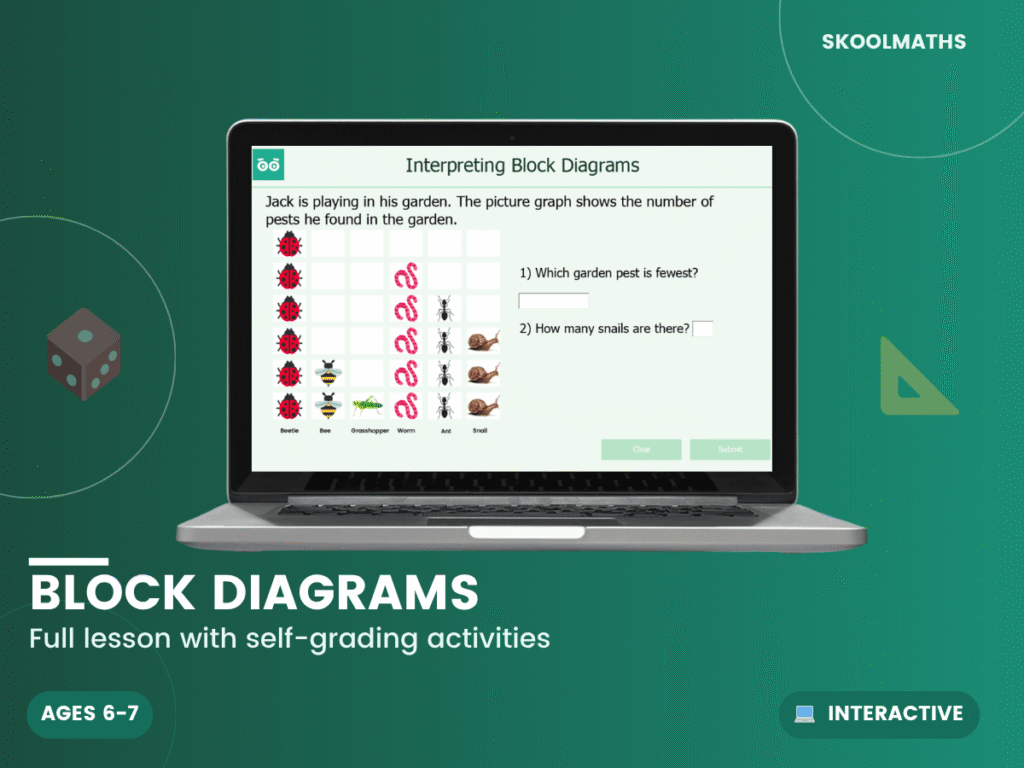
Teach Year 2 pupils to read and interpret information from block diagrams. Aligned to the Year 2 National Curriculum for maths, this resource develops pupils’ ability to read and answer questions about data presented in block diagrams.
The National Curriculum for Year 2 Maths requires pupils to develop fluency, mathematical reasoning and problem-solving skills in interpreting block diagrams. This resource provides structured, engaging activities that build confidence and deep understanding.
Ready to build fluency and confidence in interpreting block diagrams? Download this Year 2 Maths resource today for instant classroom impact. Click ‘Add to Cart’ for immediate access.
Designed for ages 6–7 (UK Year 2 / US 1st Grade). Aligned to the UK National Curriculum; adaptable to US state standards.
| Year Group | Year 2 Maths |
|---|---|
| Resource Type | 🎓 Interactive Lesson & Activities |
| Format | Digital Only |
| Curriculum | England & Wales — KS1 (Years 1–2) |
| Added | 4 March 2026 |
Membership unlocks this resource plus every lesson, worksheet and activity — all subjects, all year groups, all in one place.