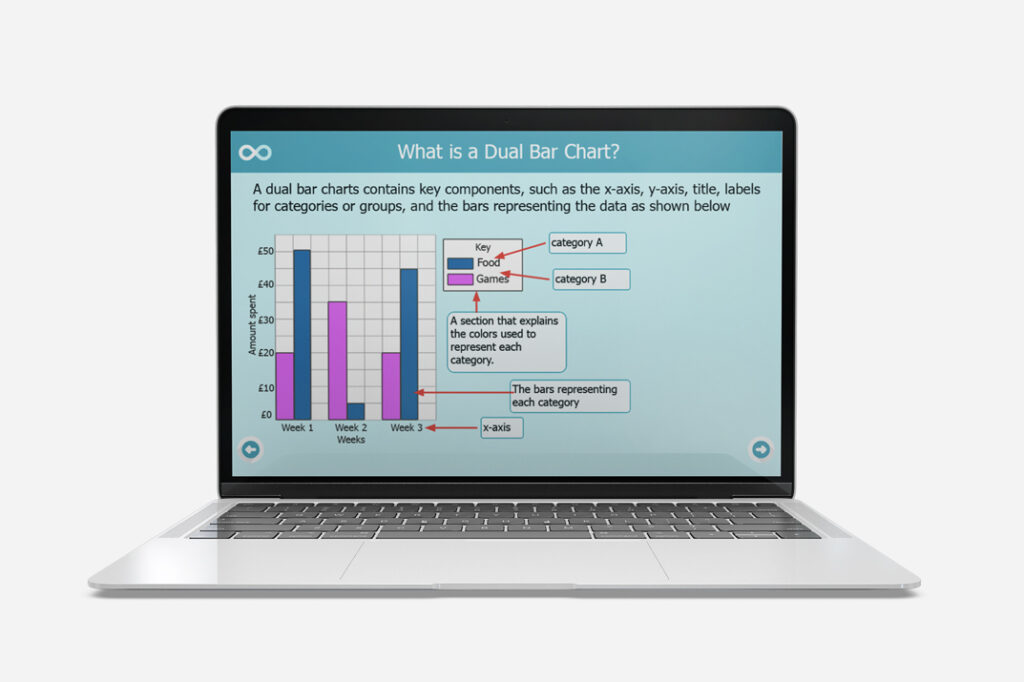
Dual Bar Charts

Master dual bar charts! Learn how to create, understand, and interpret dual bar charts to compare two sets of data effectively. Perfect for enhancing your data analysis and comparison skills.
dual bar charts
Description

By the end of this unit, students will:

  1. understand and create dual bar charts;
  2. interpret data from dual bar charts;
  3. use dual bar charts to compare two sets of data.

Year 6 Geometry:Properties of shapes

  • interpret and construct pie charts and line graphs and use these to solve problems

Not a Member Yet?

Get Unlimited Access to the Entire Library of Resources.

Trusted by Educators and Loved by Students Worldwide

Choose Your Plan

Maths and Science

£ 7
99

Monthly
  • Access to all subjects
  • Downloadable resources
  • Progress tracking for one user
Best Value

Maths

£ 4
99

Monthly
  • Access to all Maths Content
  • Downloadable resources
  • Progress tracking for one user

Science

£ 4
99

Monthly
  • Access to all Science Content
  • Downloadable resources
  • Progress tracking for one user

Maths and Science

£ 12
99

Monthly
  • Access for multiple users
  • Access to all subjects
  • Downloadable resources
  • Progress tracking for all users
Best Value

Maths

£ 7
99

Monthly
  • Access for multiple users
  • Access to all Maths Content
  • Downloadable resources
  • Progress tracking for all users

Science

£ 7
99

Monthly
  • Access for multiple users
  • Access to all Science Content
  • Downloadable resources
  • Progress tracking for all users