histograms (2)

Histograms

Develop your GCSE Maths student ability to construct and interpret histograms for different sets of data and analyze and draw conclusions from the information presented in histograms.

Target Age:

Lesson Overview

By the end of this unit, students will be able to:

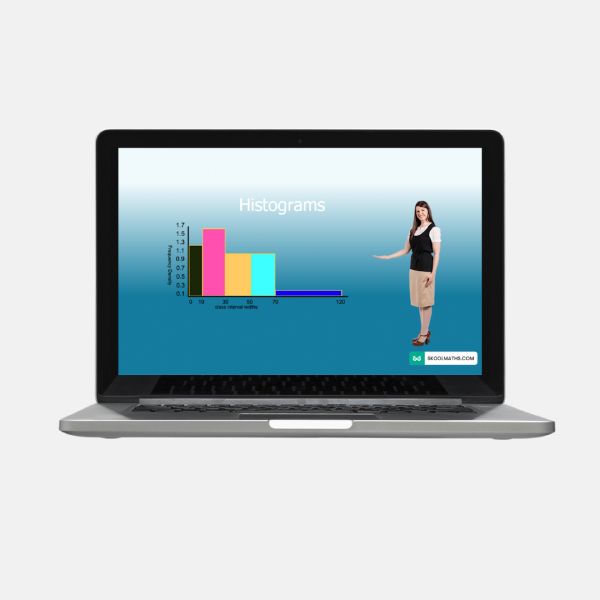
  1. understand the concept of histograms and their role in displaying data distributions;
  2. construct and interpret histograms for different sets of data;
  3. analyze and draw conclusions from the information presented in histograms.

Curriculum Alignment: Key Stage 4: Statistics

  • {construct and interpret diagrams for grouped discrete data and continuous data, ie, histograms with equal and unequal class intervals and cumulative frequency graphs, and know their appropriate use}
Last updated on: February 20, 2026

More Resources You’ll Love

upper and lower bounds
Upper and Lower Bounds
systematic listings and the product rule for counting
Systematic Listings and the Product Rule for Counting
estimating answers
Estimating Answers
simplifying surds
Introduction to Surd