sample space diagrams

Probability of Two Events

Strengthen your ability to calculate the probability of two events by building on systematic listing techniques. This lesson enhances problem-solving skills and deepens understanding of probability concepts.

Target Age:

Lesson Overview

By the end of this unit, students will:

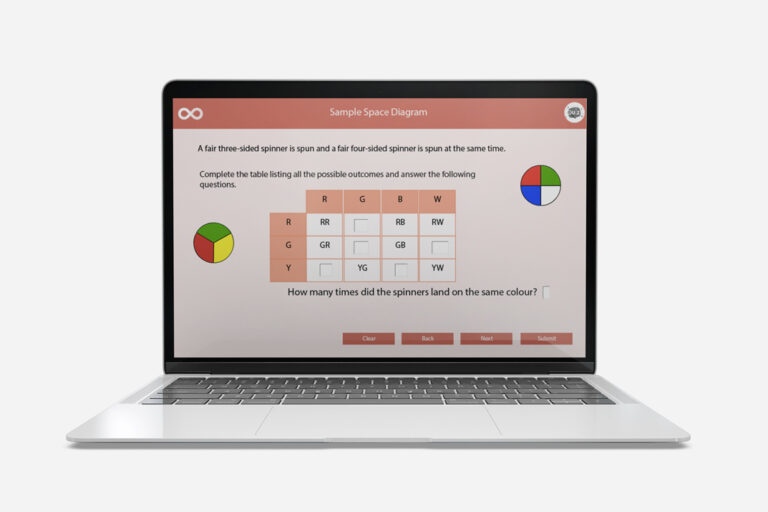
  1. build on the previous learning of systematic listings for the outcome of two events;
  2. and use this to calculate the probability of two events.

Curriculum Alignment: Key Stage 3: Statistics

  • construct and interpret appropriate tables, charts, and diagrams, including frequency tables, bar charts, pie charts, and pictograms for categorical data, and vertical line (or bar) charts for ungrouped and grouped numerical data
Last updated on: February 21, 2026

More Resources You’ll Love

decimal place value trivial game
Decimal Place Value Trivial Game
fraction operations poster
Fraction Operations Poster
fraction strip decimal percentage math poster
Fraction Strip Decimal Percentage Math Poster
Thermal Energy & Heat Transfer Exit Ticket Assessment