This site uses cookies for analytics and to improve your experience. By clicking Accept, you consent to our use of cookies. Learn more in our privacy policy.
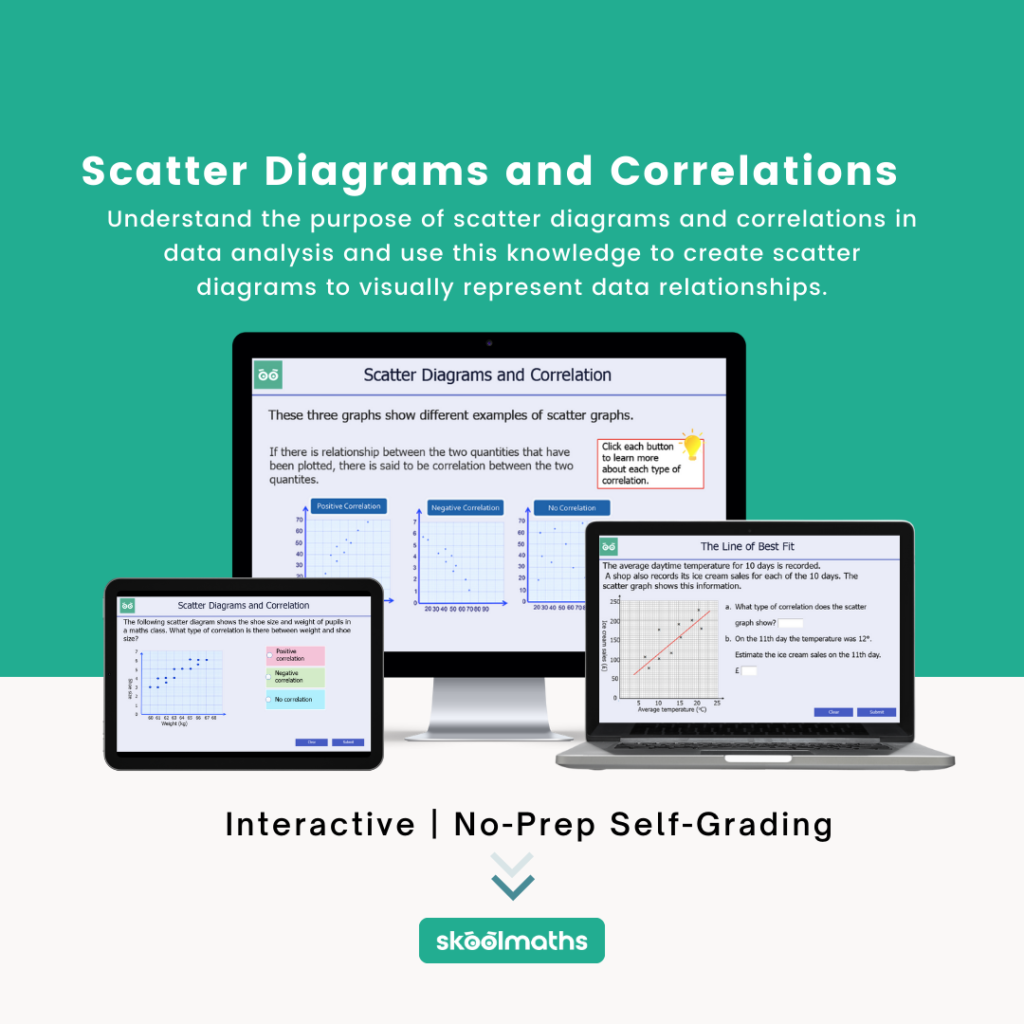
Understand the purpose of scatter diagrams and correlations in data analysis and use this knowledge to create scatter diagrams to visually represent data relationships.
By the end of this unit, students will be able to:
understand the purpose of scatter diagrams and correlations in data analysis;
create scatter diagrams to visually represent data relationships;
calculate and interpret correlation coefficients to determine the strength and direction of relationships.
National Curriculum Objectives
Key Stage 4: Statistics
use and interpret scatter graphs of bivariate data; recognise correlation and know that it does not indicate causation; draw estimated lines of best fit; make predictions; interpolate and extrapolate apparent trends whilst knowing the dangers of so doing.