Scatter Graphs
Master scatter graphs by learning to plot data points, understand variable relationships, and accurately represent data. Perfect for building analytical skills in math and data interpretation.

Description
By the end of this unit, students will:
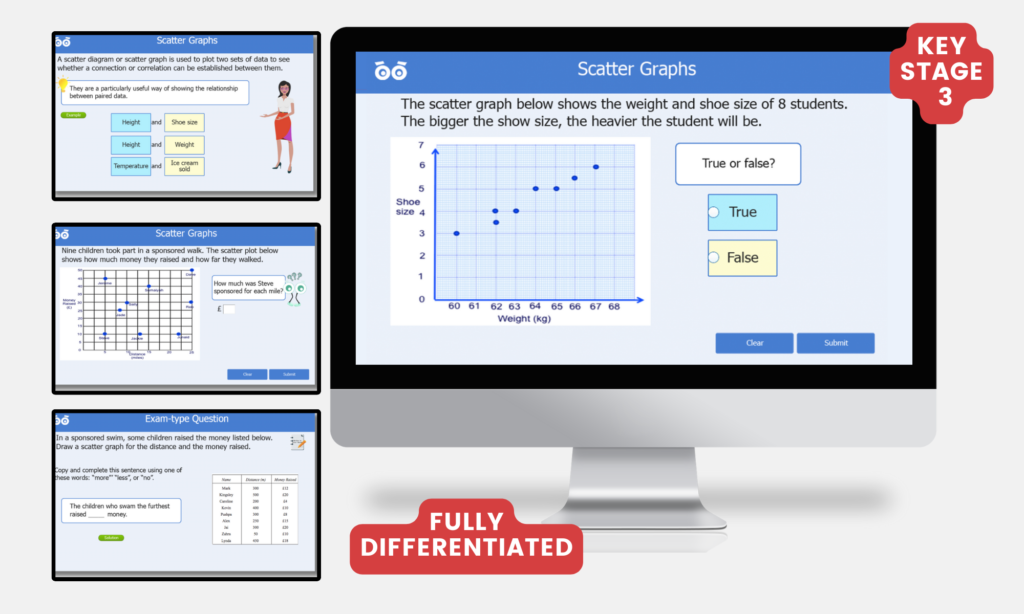
- Understand that a scatter graph is a way to represent data with two variables, typically one on the horizontal (x-axis) and the other on the vertical (y-axis).
- Recognize that each point on the graph represents a data pair.
- Plot data points accurately on a scatter graph, with each point representing a pair of values.
- Identify and describe different types of relationships that may appear on a scatter graph.
Links to Curriculum
Key Stage 3: Statistics
Describe, interpret, and compare observed distributions of a single variable through appropriate graphical representation involving discrete, continuous, and grouped data; and appropriate measures of central tendency (mean, mode, median) and spread (range, consideration of outliers)
Target Ages
- Age: 11-12
- England & Wales: Year 7
- Scotland: P7
- Rep. Ireland: 6th Class
- Australia: Grade 6
- USA: Grade 6
What's Included
- Three-part Lesson
- Self-marking Activities
- Fluency, Reasoning and Problem-solving Questions.
- Engaging Drag and Drop Activities
- Interactive Self-marking Worksheet
- Printable Worksheets to Consolidate Learning
Trusted by Educators and Loved by Students Worldwide
Right for my child, the 4th option we've used this year, and my daughter is learning well!

I've used Skoolmaths for 6 months. Engaging, easy to use, and perfect for extra practice. My son loves it!

Skoolmaths offers everything for my classrooms, including engaging digital activities and printable worksheets.

Since subscribing to Skoolmaths, my children have improved greatly with engaging and effective interactive learning materials.

I use the resources primarily for students with learning difficulties, and on the autism spectrum for extra practice and during independent centers.

Choose Your Plan
Maths and Science
£
7
Monthly
99
Monthly
- Access to all subjects
- Downloadable resources
- Progress tracking for one user
Best Value
Maths
£
4
Monthly
99
Monthly
- Access to all Maths Content
- Downloadable resources
- Progress tracking for one user
Science
£
4
Monthly
99
Monthly
- Access to all Science Content
- Downloadable resources
- Progress tracking for one user
Maths and Science
£
12
Monthly
99
Monthly
- Access for multiple users
- Access to all subjects
- Downloadable resources
- Progress tracking for all users
Best Value
Maths
£
7
Monthly
99
Monthly
- Access for multiple users
- Access to all Maths Content
- Downloadable resources
- Progress tracking for all users
Science
£
7
Monthly
99
Monthly
- Access for multiple users
- Access to all Science Content
- Downloadable resources
- Progress tracking for all users


