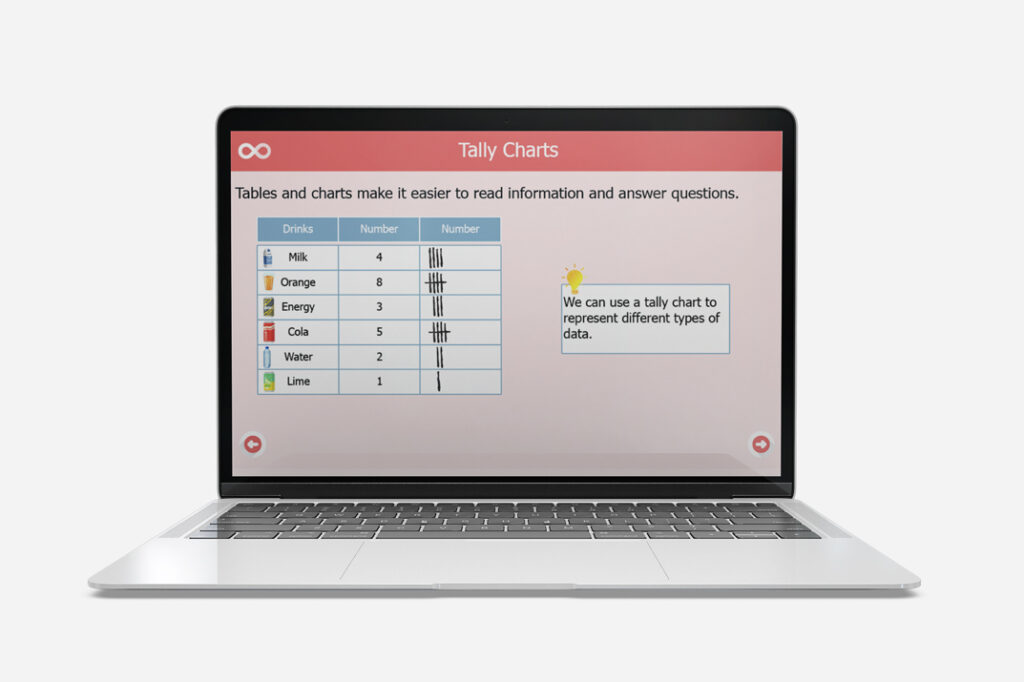
Interpret and Make Tally Charts

tally charts

By the end of this unit, children will be able to:

  1. Understand the concept of tally charts as a way to record and represent data.
  2. Interpret information from tally charts, including counting and calculating totals.
  3. Recognize and differentiate between tally marks and their corresponding quantities.
  4. Organize and categorize data using tally charts.
  5. Create tally charts to represent given data sets.
  6. Solve problems and answer questions based on tally chart information.

What's Included

Year 2 Statistics:

  • Interpret and construct simple pictograms, tally charts, block diagrams and tables.
  • Ask and answer simple questions by counting the number of objects in each category and sorting the categories by quantity.
  • Ask-and-answer questions about totalling and comparing categorical data.

Not a Member Yet?

Get Unlimited Access to the Entire Library of Resources.

Trusted by Educators and Loved by Students Worldwide

Choose Your Plan

Maths and Science

£ 7
99

Monthly
  • Access to all subjects
  • Downloadable resources
  • Progress tracking for one user
Best Value

Maths

£ 4
99

Monthly
  • Access to all Maths Content
  • Downloadable resources
  • Progress tracking for one user

Science

£ 4
99

Monthly
  • Access to all Science Content
  • Downloadable resources
  • Progress tracking for one user

Maths and Science

£ 12
99

Monthly
  • Access for multiple users
  • Access to all subjects
  • Downloadable resources
  • Progress tracking for all users
Best Value

Maths

£ 7
99

Monthly
  • Access for multiple users
  • Access to all Maths Content
  • Downloadable resources
  • Progress tracking for all users

Science

£ 7
99

Monthly
  • Access for multiple users
  • Access to all Science Content
  • Downloadable resources
  • Progress tracking for all users