This site uses cookies for analytics and to improve your experience. By clicking Accept, you consent to our use of cookies. Learn more in our privacy policy.
Master data interpretation with this lesson! Students will learn how to interpret and present data using bar charts, and solve one- and two-step questions based on scaled bar charts.
By the end of this unit, students will be able to:
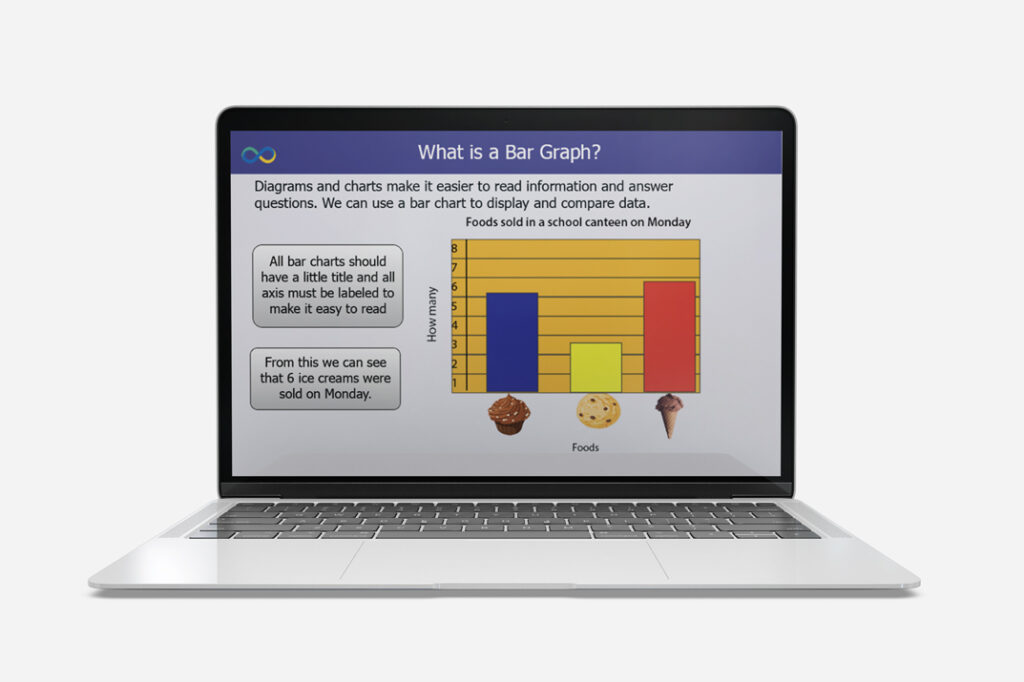
Interpret and present data using bar charts
Solve one-step questions using information presented in scaled bar charts
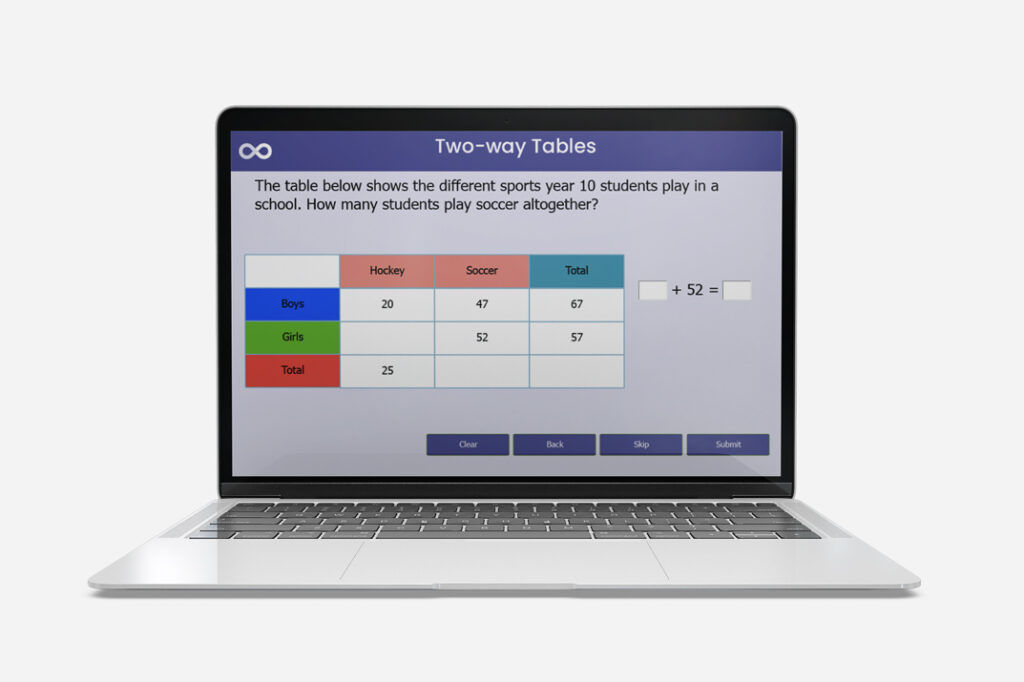
solve two-step questions using information presented in scaled bar charts
National Curriculum Objectives
Year 3 Statistics
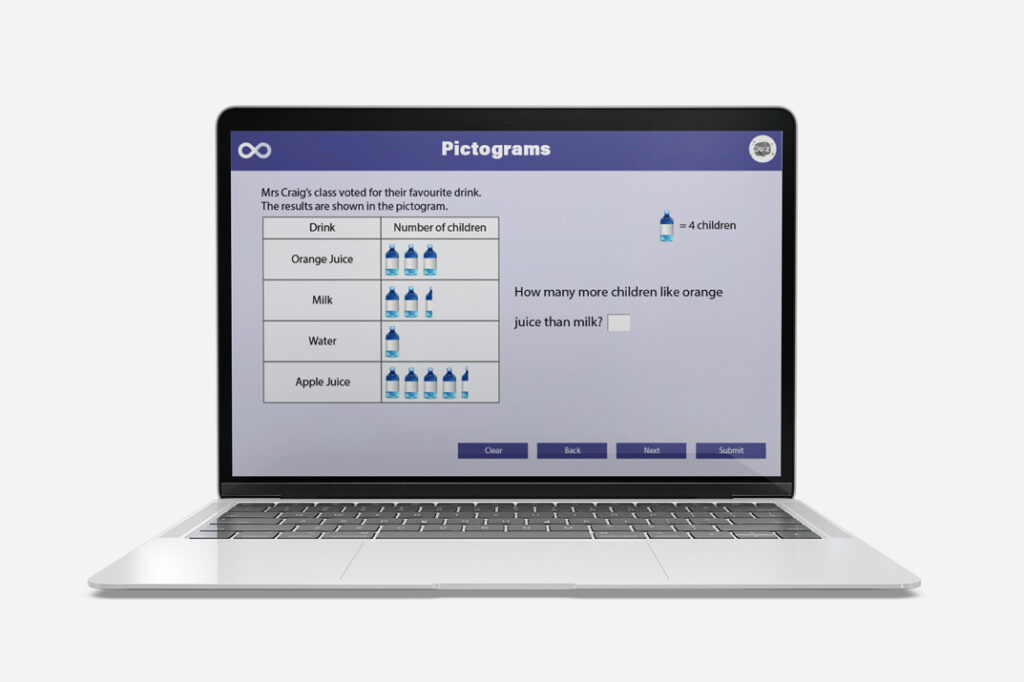
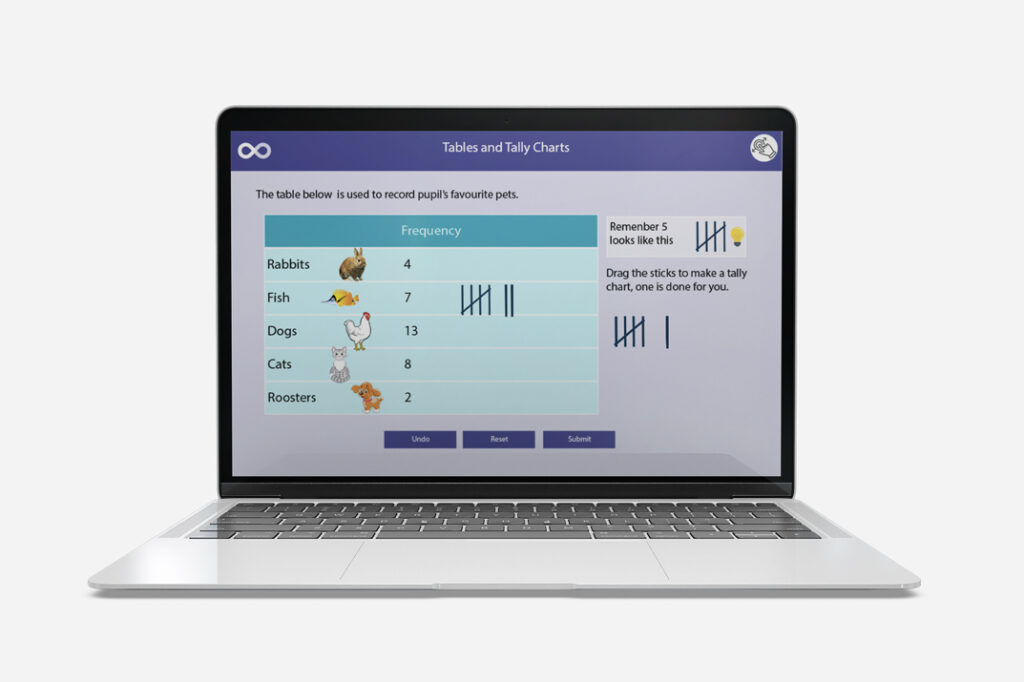
interpret and present data using bar charts, pictograms and tables
solve one-step and two-step questions [for example ‘How many more?’ and ‘How many fewer?’] using information presented in scaled bar charts and pictograms and tables