One-time purchase. Instant digital download.
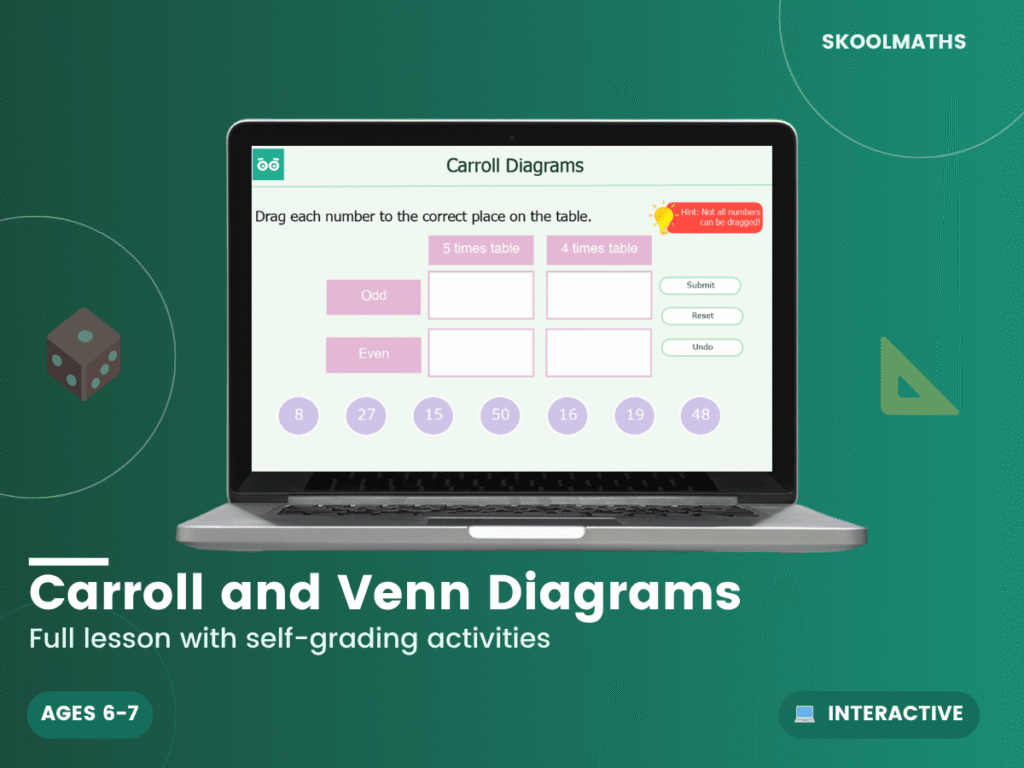
Carroll diagrams and Venn diagrams are two different tools for the same underlying skill: sorting by more than one property at once. This interactive lesson gives Year 2 pupils hands-on practice with both, built around real, specific learning objectives.
Pupils sort objects and numbers using Carroll diagrams and Venn diagrams, building genuine logical-reasoning skills alongside the maths.
This resource covers the Key Stage 1 curriculum area of grouping, sorting and interpreting data, and is built around four specific learning objectives taken directly from the lesson itself: sorting data into categories using Carroll diagrams, asking and answering questions by counting objects in each category, sorting numbers and shapes using Venn diagrams, and spotting mistakes in Carroll and Venn diagrams.
| Year Group | Year 2 Maths |
|---|---|
| Resource Type | 🎓 Interactive Lesson & Activities |
| Format | Digital Only |
| Curriculum | England & Wales — KS1 (Year 2) |
| Added | 22 April 2019 |
Membership unlocks this resource plus every lesson, worksheet and activity — all subjects, all year groups, all in one place.

Reviews
There are no reviews yet.