One-time purchase. Instant digital download.
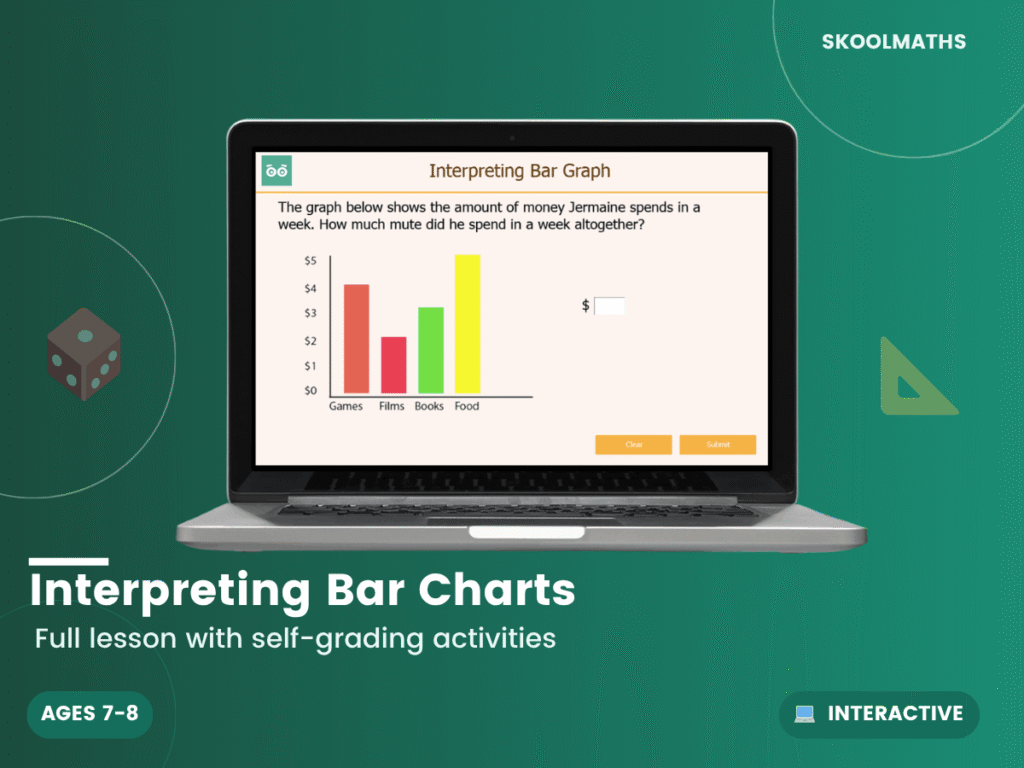
Read and Interpret Data with Confidence! Help Year 3 students develop essential statistics skills by reading and discussing bar charts in this structured, engaging lesson.
The National Curriculum for Year 3 Maths requires students to develop fluency, reasoning and problem-solving skills around Interpreting Bar Charts. This resource provides interactive, visual scaffolding to build confidence, whether used for whole-class teaching, small-group work, or independent practice.
Ready to make Interpreting Bar Charts lessons exciting and effective? Download this Year 3 Maths resource today and give your students the interactive, curriculum-aligned practice they need. Click ‘Add to Cart’ to save prep time and bring Interpreting Bar Charts to life in your classroom!
Designed for ages 7–8 (UK Year 3 / US 2nd Grade). Aligned to the UK National Curriculum; adaptable to US state standards.
| Year Group | Year 3 Maths |
|---|---|
| Resource Type | 🎓 Interactive Lesson & Activities |
| Format | Digital Only |
| Curriculum | England & Wales — KS2 (Years 3–6) |
| Added | 4 March 2026 |
Membership unlocks this resource plus every lesson, worksheet and activity — all subjects, all year groups, all in one place.