Skip to content

Interpreting And Presenting Data With Bar Charts — Interactive Lesson (Ages 7–9)

★★★★★ 5.0 Year 3 Maths 🎓 Interactive Lesson & Activities
Develop data skills with this Interpreting and Presenting Data with Bar Charts Year 3 Maths resource. This no-prep interactive lesson helps KS2 students read, interpret, and construct bar charts using data from a variety of real-world contexts.
$3.96

One-time purchase. Instant digital download.

🎓
Better value with membership Get unlimited access to this and every other resource across all subjects and year groups — for one low monthly price.
⭐ Get Unlimited Access — Members Only
Instant Access
💻 Any Device
🔒 Secure Checkout
♻️ Use Anytime

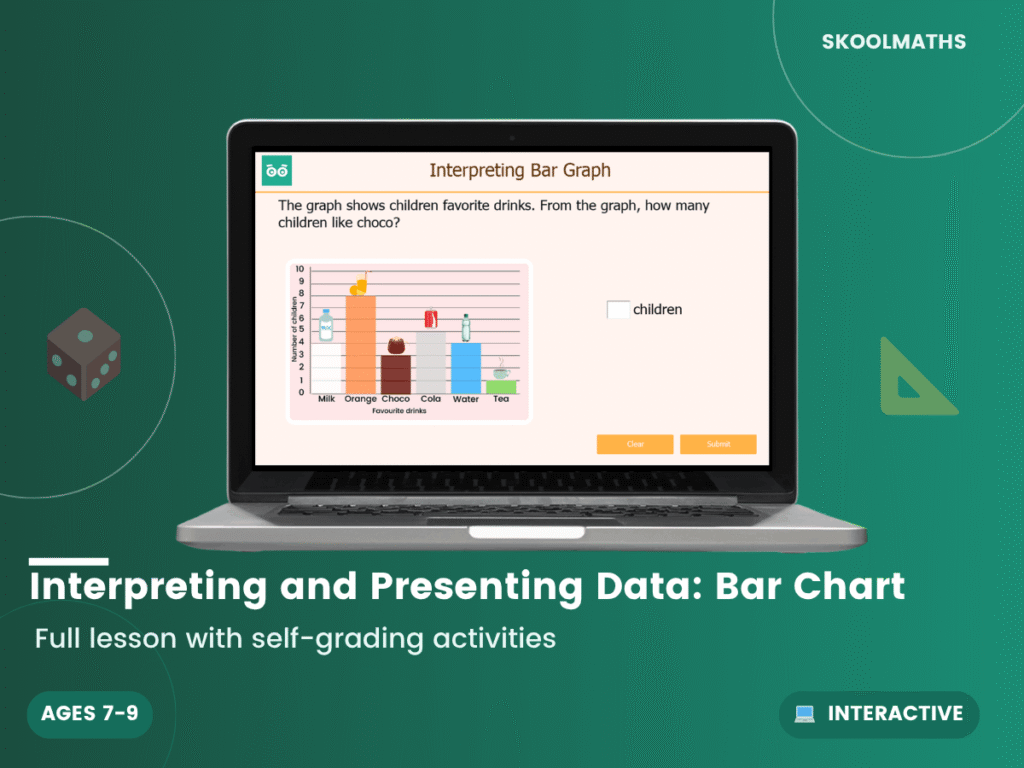
Build Confident Data Skills with Bar Charts! Help Year 3 students become fluent in reading and creating bar charts — an essential statistics skill for KS2 — through this engaging, structured lesson.

Exploring Interpreting and Presenting Data with Bar Charts with Our Year 3 Maths Interactive Lesson

The National Curriculum for Year 3 Maths requires students to develop fluency, reasoning and problem-solving skills around Interpreting and Presenting Data with Bar Charts. This resource provides interactive, visual scaffolding to build confidence, whether used for whole-class teaching, small-group work, or independent practice.

What’s Inside This Interpreting and Presenting Data with Bar Charts Year 3 Resource

  • Interactive Lesson Slides: Visually engaging slides that introduce and explain Interpreting and Presenting Data with Bar Charts step by step.
  • Guided Practice Activities: Scaffolded exercises that build from simple to more complex Interpreting and Presenting Data with Bar Charts problems.
  • Printable Worksheets: Ready-to-use worksheets for independent practice or homework, aligned to the KS2 curriculum.
  • Assessment Quiz: Quick-check questions to measure understanding and identify gaps in Interpreting and Presenting Data with Bar Charts knowledge.

Key Benefits for Students

  • Builds Core Fluency: Structured practice helps Year 3 students become confident and accurate with Interpreting and Presenting Data with Bar Charts.
  • Promotes Deep Understanding: Conceptual explanations alongside procedural practice ensure lasting learning of Interpreting and Presenting Data with Bar Charts.
  • Boosts Confidence: Clear, age-appropriate content helps every child feel successful and motivated in maths.

Why Teachers Love It

  • Zero Prep Time: A complete ‘print-and-go’ and ‘click-and-teach’ solution — open the lesson and start teaching immediately.
  • Curriculum-Aligned: Fully mapped to the KS2 National Curriculum for Year 3 Maths, saving valuable planning time.
  • Highly Flexible: Suitable for whole-class teaching, guided groups, morning work, or homework activities.

Ready to make Interpreting and Presenting Data with Bar Charts lessons exciting and effective? Download this Year 3 Maths resource today and give your students the interactive, curriculum-aligned practice they need. Click ‘Add to Cart’ to save prep time and bring Interpreting and Presenting Data with Bar Charts to life in your classroom!

Designed for ages 7–9 (UK Year 3–4 / US 2nd Grade–3rd Grade). Aligned to the UK National Curriculum; adaptable to US state standards.

Year GroupYear 3 Maths
Resource Type🎓 Interactive Lesson & Activities
FormatDigital Only
CurriculumEngland & Wales — KS2 (Years 3–6)
Added22 April 2019

🎓 Get every resource for one low price

Membership unlocks this resource plus every lesson, worksheet and activity — all subjects, all year groups, all in one place.

View Membership Plans →