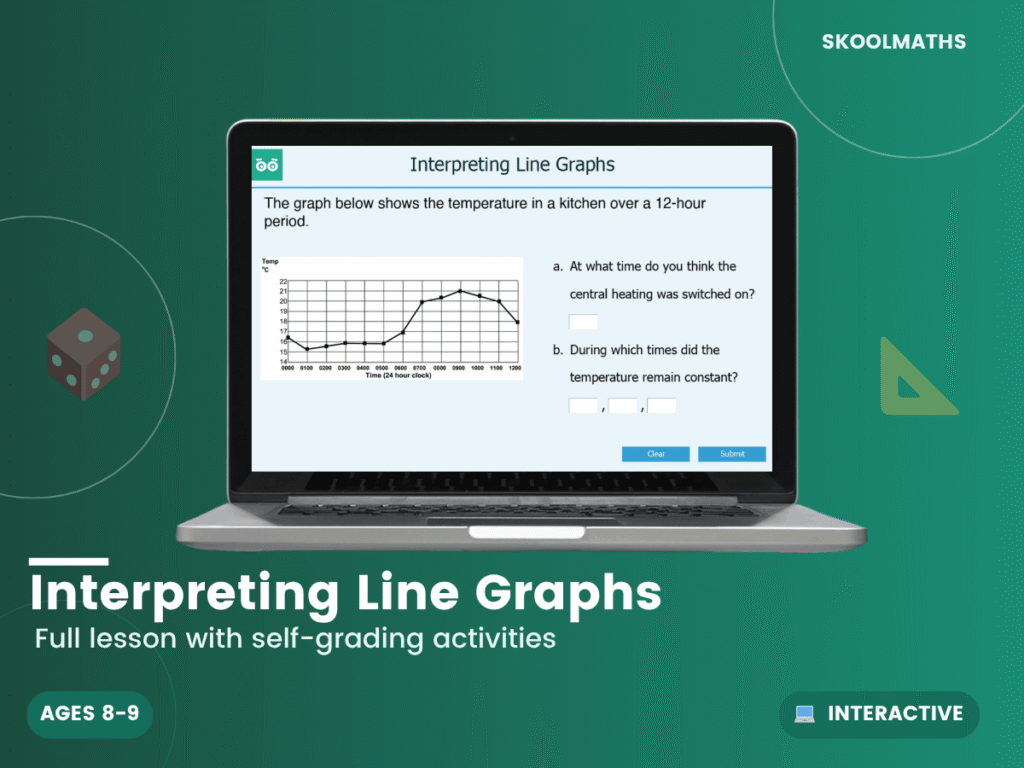
One-time purchase. Instant digital download.
A line graph turns a string of numbers into a shape a pupil can read at a glance. This interpreting line graphs lesson, built as a 28-slide interactive lesson, gives Year 4 learners focused practice reading trends and answering questions from real line graphs.
Learners read values from a line graph, describe how a measurement changes over time, and answer comparison questions, with instant self-marking feedback throughout.
This resource covers the Year 4 National Curriculum area of statistics, interpreting and presenting continuous data using line graphs to show how a value changes over time.
Line graphs track everything from daily temperature to a plant’s growth or a football team’s league position over a season. Interpreting line graphs gives pupils a genuine tool for reading the changing data they meet outside school.
| Year Group | Year 4 Maths |
|---|---|
| Resource Type | 🎓 Interactive Lesson & Activities |
| Format | Digital Only |
| Curriculum | England & Wales — KS2 (Year 4) |
| Added | 4 March 2026 |
Membership unlocks this resource plus every lesson, worksheet and activity — all subjects, all year groups, all in one place.



Reviews
There are no reviews yet.