Skip to content

Interpret and Present Data: Year 5 Maths Interactive Lesson & Statistics Activities

★★★★★ 5.0 Year 5 Maths 📁 Digital Resource
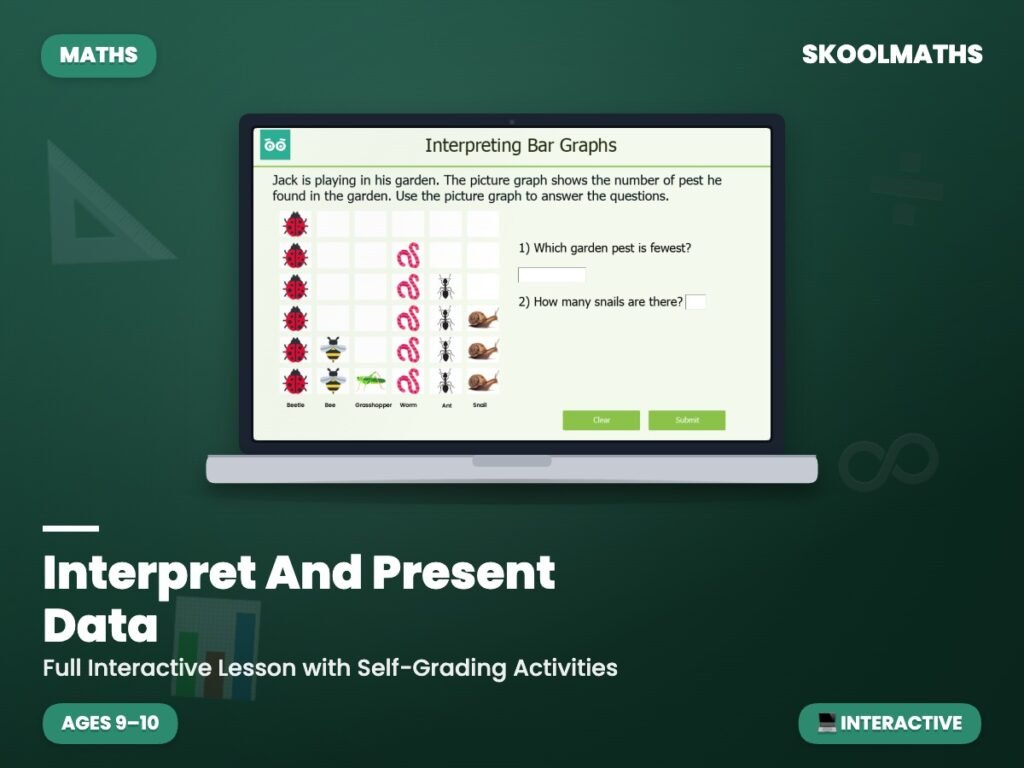
Year 5 maths interactive lesson on interpreting and presenting data using tables, bar charts and line graphs, with data analysis and statistics reasoning tasks.
$6.75

One-time purchase. Instant digital download.

🎓
Better value with membership Get unlimited access to this and every other resource across all subjects and year groups — for one low monthly price.
⭐ Get Unlimited Access — Members Only
Instant Download
🖨️ Print & Digital
🔒 Secure Checkout
♻️ Unlimited Use

Develop Year 5 pupils’ ability to interpret and present data in a variety of graphs and charts. Aligned to the Year 5 National Curriculum for maths, this resource develops pupils’ skills in reading, interpreting and constructing different data representations including tables, bar charts and line graphs.

Mastering interpreting and presenting data with Our Year 5 Maths Interactive Lesson & Statistics Activities

The National Curriculum for Year 5 Maths requires pupils to develop fluency, mathematical reasoning and problem-solving skills in interpreting and presenting data. This resource provides structured, engaging activities that build confidence and deep understanding.

What’s Inside This interpreting and presenting data Resource

  • Interactive lesson slides on interpreting and presenting data
  • Data reading and interpretation activities
  • Constructing and presenting data in different formats
  • Statistics reasoning and comparison tasks
  • Printable worksheet and quiz slides

Key Benefits for Students

  • Develops fluency in interpreting a range of data representations
  • Builds skills in presenting data clearly and accurately
  • Encourages analytical thinking about data patterns
  • Supports cross-curricular statistics and data literacy

Why Teachers Love It

  • Curriculum-aligned to Year 5 statistics objectives
  • Works as a comprehensive data handling unit resource
  • Pairs with individual bar chart and line graph resources
  • Digital format for whole-class or independent use

Ready to build fluency and confidence in interpreting and presenting data? Download this Year 5 Maths resource today for instant classroom impact. Click ‘Add to Cart’ for immediate access.

Year GroupYear 5 Maths
Resource Type📁 Digital Resource
FormatPrint & Digital
CurriculumEngland & Wales — KS2 (Years 3–6)
Added4 March 2026

🎓 Get every resource for one low price

Membership unlocks this resource plus every lesson, worksheet and activity — all subjects, all year groups, all in one place.
View Membership Plans →