Skip to content

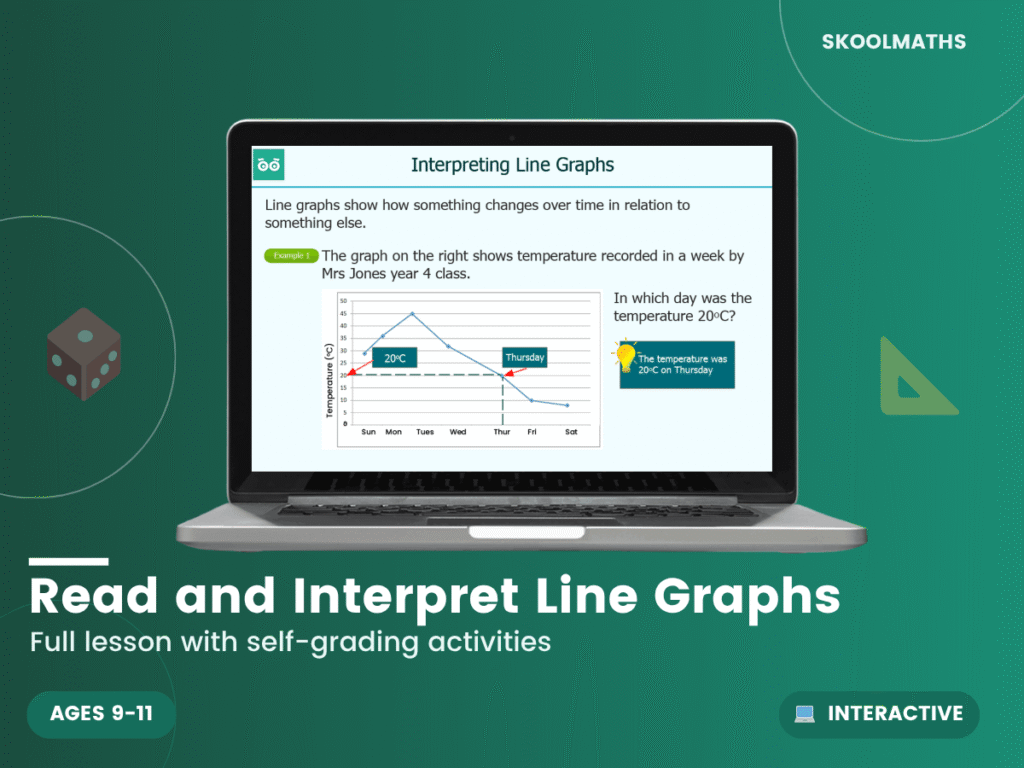
Read And Interpret Line Graphs — Interactive Lesson (Year 5–6)

☆☆☆☆☆ Add your review • Year 5–6 • 🎓 Interactive Lesson & Activities
Year 5 maths interactive lesson on reading and interpreting line graphs, with data-reading tasks, answering questions and trend analysis activities.

Included in every Skoolmaths plan

  • This resource plus every lesson, worksheet and game in its year group
  • Interactive lessons that mark answers and read aloud
  • New resources added every month
⭐ Get every resource with a Skoolmaths plan

or buy just this resource for £3.40

✅ Instant Access
💻 Any Device
🔒 Secure Checkout
♻️ Use Anytime

Lesson at a glance

What pupils will learn

  • Read values from line graphs
  • Find differences and changes
  • Describe trends

Curriculum

UK
Year 5–6 Maths, National Curriculum (England)
Topic area
Statistics
US equivalent
Grades 4–5 (year level only; not mapped to US standards)

How it is interactive

  • 27 fill-in-the-blank questions
  • 3 multiple-choice questions
  • 1 true or false question

Feedback and what you get

Questions are marked automatically as pupils answer: a sound and a character reaction show straight away whether they are right, and correct answers earn points, with a results screen at the end.

A 35-slide interactive lesson that runs in any web browser on a computer, tablet or interactive whiteboard. Members open it online from their year group page. Buying it on its own gives you a .zip download to unzip and open.

Free preview: try the first slides before you decide. Included in every Skoolmaths plan.

Teach Year 5 pupils to read, interpret and reason about line graphs with confidence. Aligned to the Year 5 National Curriculum for maths, this resource develops pupils’ ability to read values from line graphs, describe trends and solve problems using data.

Mastering reading and interpreting line graphs with Our Year 5 Maths Interactive Lesson & Statistics Activities

The National Curriculum for Year 5 Maths requires pupils to develop fluency, mathematical reasoning and problem-solving skills in reading and interpreting line graphs. This resource provides structured, engaging activities that build confidence and deep understanding.

What’s Inside This reading and interpreting line graphs Resource

  • Interactive lesson slides on reading and interpreting line graphs
  • Data-reading activities from varied line graph examples
  • Trend identification and comparison tasks
  • Reasoning and inference questions
  • Interactive quiz slides to check understanding

Key Benefits for Students

  • Builds confidence in reading and interpreting line graphs
  • Develops statistical vocabulary for trends and change over time
  • Encourages analytical thinking about data patterns
  • Supports cross-curricular data handling skills

Why Teachers Love It

  • Curriculum-aligned to Year 5 statistics objectives
  • Real-world data contexts make graphs engaging
  • Works within a statistics and data handling unit
  • Digital format for whole-class or independent use

Ready to build fluency and confidence in reading and interpreting line graphs? Download this Year 5 Maths resource today for instant classroom impact. Click ‘Add to Cart’ for immediate access.

Designed for ages 9–11 (UK Year 5–6). Aligned to the UK National Curriculum; adaptable to US state standards.

Year GroupsYear 5–6
Resource Type🎓 Interactive Lesson & Activities
FormatDigital Only
CurriculumEngland & Wales — KS2 (Years 5–6)
Added4 March 2026

Reviews

There are no reviews yet.

Add your review

Your email address will not be published. Required fields are marked *

🎓 Get every resource for one low price

Membership unlocks this resource plus every lesson, worksheet and activity — all subjects, all year groups, all in one place.
View Membership Plans →

Free: our First Two Weeks Starter Pack

Eight print-and-go pages for a calm start with a new class, plus new lessons as we add them. About two emails a month.