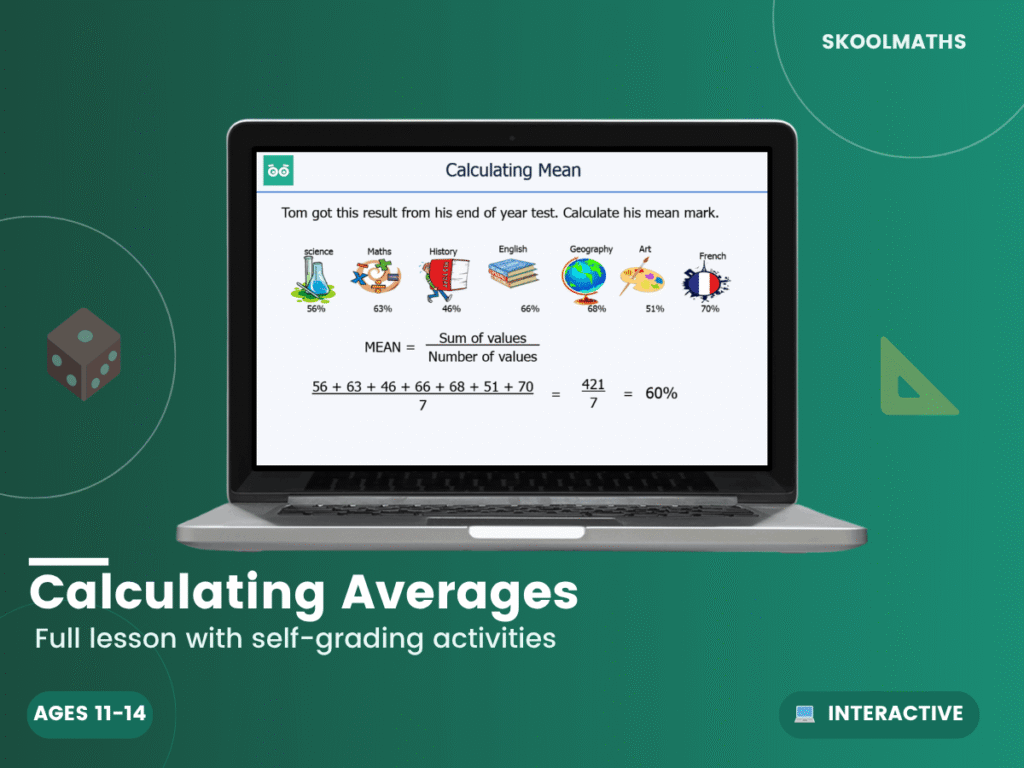
Master data analysis with Calculating Averages KS3. This "no-prep" interactive digital lesson helps Year 7 and 8 students confidently calculate and compare the mean, median, mode, and range from various datasets.
One-time purchase. Instant digital download.
Demystify Data and Statistics! Understanding how to summarize a set of data is a vital life skill and a core mathematical checkpoint. Our Calculating Averages KS3 toolkit is a comprehensive guide designed to help students move past simply memorizing formulas and transition into true statistical understanding. By exploring when and why to use different measures of central tendency, students gain the analytical tools required for higher-level data handling and real-world decision-making.
In Year 7 and 8, the National Curriculum focuses on pupils “interpreting, describing and comparing datasets using an appropriate measure of central tendency (mean, mode, median) and spread (range).” This Interactive Maths Lesson provides the clear visual scaffolding needed to keep these distinct calculations separate. Students will learn the step-by-step methods for calculating averages from discrete data lists, understanding how outliers affect the mean, and interpreting what the spread actually tells us about a dataset.
50+ Interactive Slides: Dynamic digital lessons featuring “The Average Investigator” challenges to calculate statistics in context.
The Outlier Effect: Animated modules demonstrating how extreme values skew the mean compared to the median.
Formula Mastery Guides: Memorable rhyme and visual prompts to help students permanently remember how to find the mean, median, mode, and range.
Differentiated Worksheets: Three levels of printable tasks, including data-sorting puzzles, real-world sports stat analysis, and reverse average problems (finding a missing data point).
Self-Marking Plenary Quiz: A digital check-for-understanding to ensure students have mastered the mechanics of calculating averages.
Improves Statistical Fluency: Eliminates the classic confusion between the three “M”s and the range through repetitive, contextual practice.
Enhances Critical Thinking: Teaches students to select the most appropriate average (e.g., why a shop owner needs the mode, but a teacher wants the mean).
Builds Exam Confidence: Prepares students for the multi-step data interpretation questions commonly found in secondary assessments.
KS3 Curriculum Aligned: Precisely mapped to the “Statistics” strand of the Year 7 and Year 8 National Curriculum.
Zero Prep Time: A complete “plug-and-play” solution—ideal for a main statistics block, an entry-level revision session, or targeted intervention groups.
Visual & Structured: High-contrast layouts, clear step-by-step algorithms, and color-coded data lists make this topic highly accessible for SEN and EAL learners.
Love this? You’ll love…
Ready to help your students conquer data analysis once and for all? Download the Calculating Averages KS3 toolkit today and give your class a clear, structured framework for mastering statistics. Click ‘Add to Cart’ to reclaim your prep time and watch your students’ analytical confidence soar!
| Year Group | Year 9 Maths |
|---|---|
| Resource Type | 📋 Lesson Pack |
| Format | Print & Digital |
| Curriculum | England & Wales — KS3 (Years 7–9) |
| Added | 4 March 2026 |
Membership unlocks this resource plus every lesson, worksheet and activity — all subjects, all year groups, all in one place.