One-time purchase. Instant digital download.
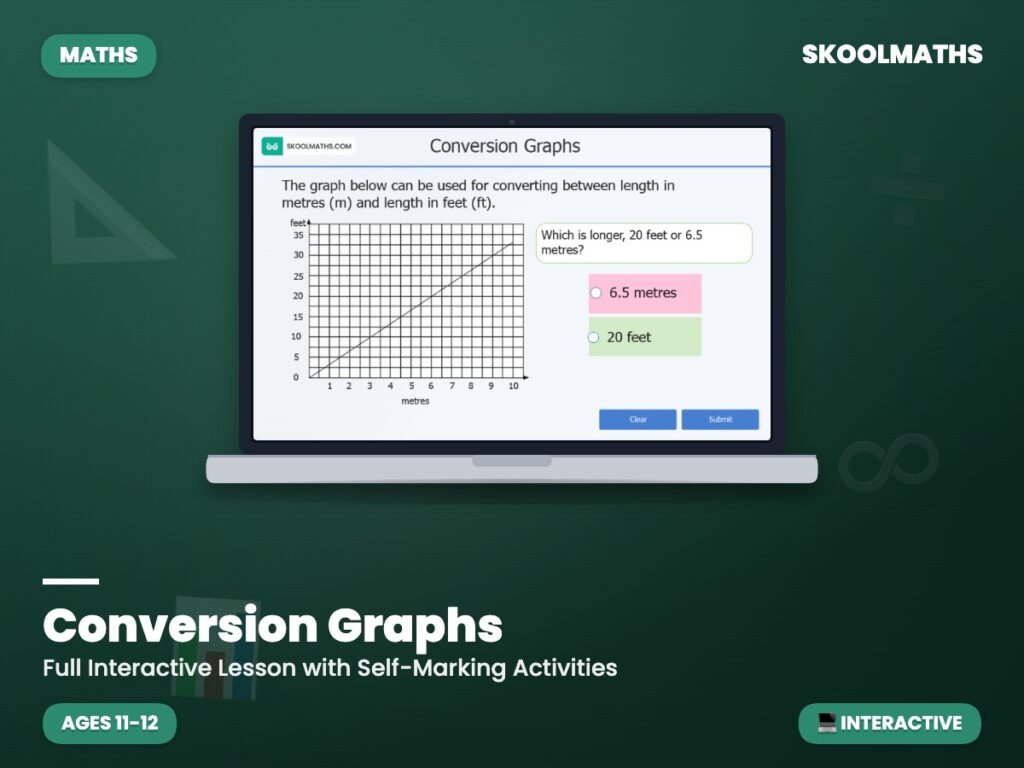
Still counting individual gridlines instead of reading a conversion graph efficiently? This substantial 25-slide interactive lesson gives pupils extensive, self-marking practice reading and interpreting conversion graphs.
Pupils practise reading values from a conversion graph and using it to convert between two related quantities, building the fluency within the Year 7 National Curriculum area of ratio and proportion. Genuine confidence reading a graph accurately, rather than just following gridlines by eye, is a skill this lesson gives pupils extensive, varied practice developing.
A strong addition to any Year 7 ratio and proportion topic, giving pupils a genuinely graphical way to reason about proportional relationships rather than relying on calculation alone. This skill also transfers directly to reading graphs in science lessons, where similar conversions appear regularly throughout the entire school year and well beyond.
Build confident graph-reading skills today — Add to Basket.
What year group is this for? Year 7 (ages 11–12).
Does it cover drawing conversion graphs too? This lesson focuses on reading and interpreting existing graphs.
Is it self-marking? Yes, instant feedback throughout.
| Year Group | Year 7 Maths |
|---|---|
| Resource Type | 🎓 Interactive Lesson & Activities |
| Format | Digital Only |
| Curriculum | England & Wales — KS3 (Year 7) |
| Added | 22 April 2019 |
Verified reviews left by teachers who bought this resource on our TES and Teachers Pay Teachers stores.
This was a great resource for my students. It was engaging and helped cement the concepts for them.
Membership unlocks this resource plus every lesson, worksheet and activity — all subjects, all year groups, all in one place.


Reviews
There are no reviews yet.