One-time purchase. Instant digital download.
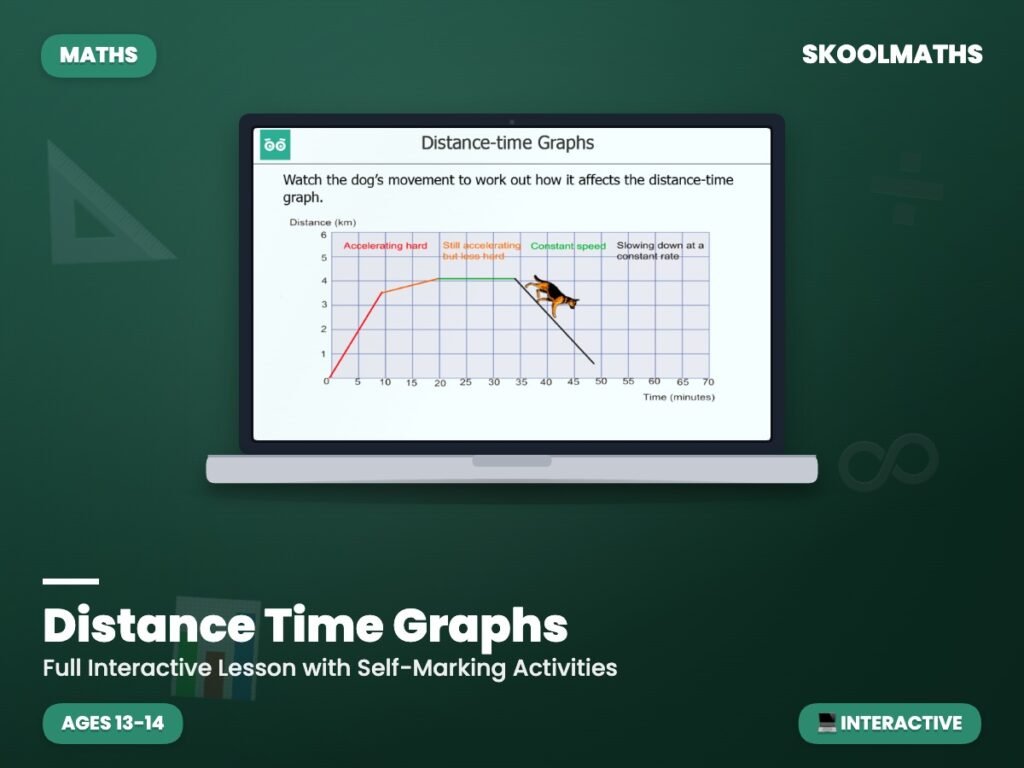
Can your students read a whole journey from a single graph? This 31-slide interactive lesson teaches them to interpret and construct distance time graphs, using real journeys and self-marking questions.
Students learn that the horizontal axis shows time while the vertical axis shows distance, then follow real journeys, including a car trip to a friend’s house in three distinct parts. They decide whether a line shows constant speed, slowing down or accelerating hard, read distances and times from a graph, and find the total distance and speed of a journey. The lesson ends by constructing a distance time graph from given information.
A dependable addition to a Year 9 graphs topic, giving students a clear method for reading and drawing graphs of journeys. Describing what each section means is a skill they will use again in later maths work.
Build confident graph-reading skills today — Add to Basket.
What year group is this for? Year 9 (ages 13–14).
Does it cover drawing the graph as well as reading it? Yes — the lesson finishes by constructing a distance time graph.
Is it self-marking? Yes, with instant feedback on the questions.
| Year Group | Year 9 Maths |
|---|---|
| Resource Type | 🎓 Interactive Lesson & Activities |
| Format | Digital Only |
| Curriculum | England & Wales — KS3 (Year 9) |
| Added | 22 April 2019 |
Membership unlocks this resource plus every lesson, worksheet and activity — all subjects, all year groups, all in one place.

Reviews
There are no reviews yet.