Description
By the end of this unit, students will be able to:
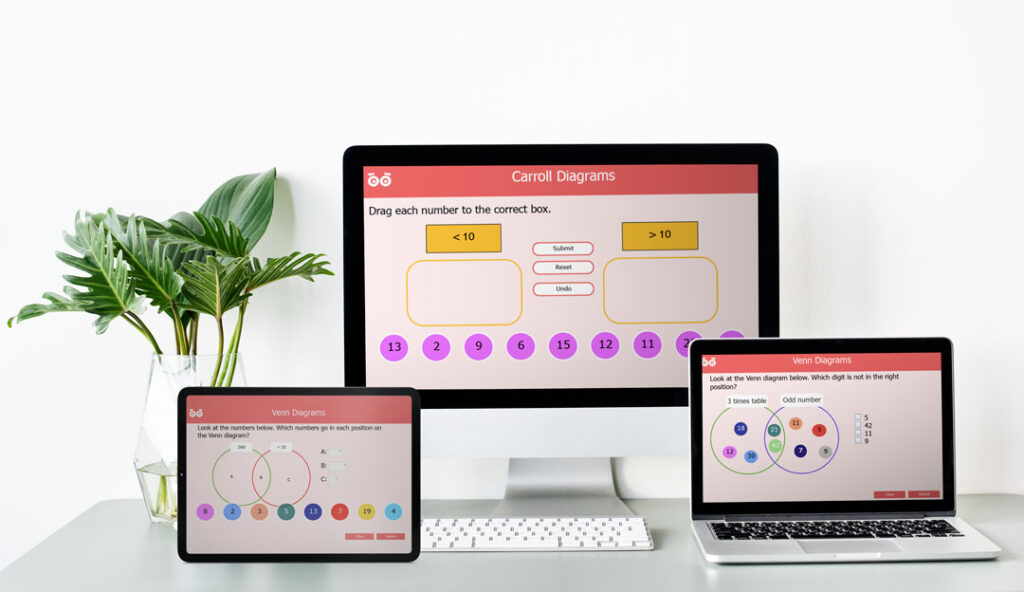
- Understand the concept of Carroll and Venn diagrams as tools for organizing and comparing data.
- Identify and differentiate between Carroll and Venn diagrams.
- Sort and categorize objects or data using Carroll and Venn diagrams.
- Use diagrams to find commonalities and differences between sets of objects or data.
- Solve problems involving data comparison and organization using diagrams.
National Curriculum Objectives
Year 2 Statistics:
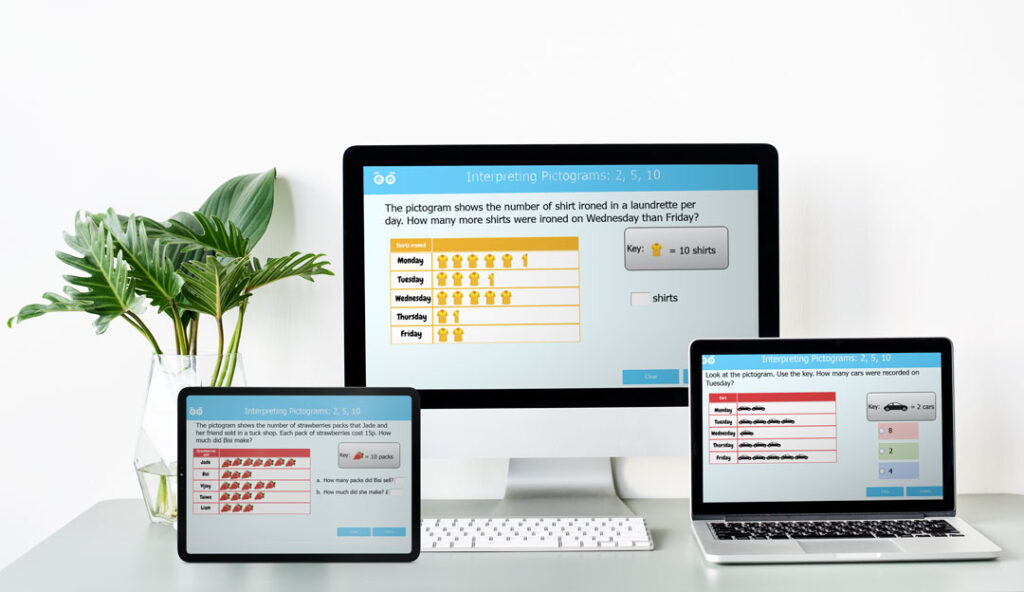
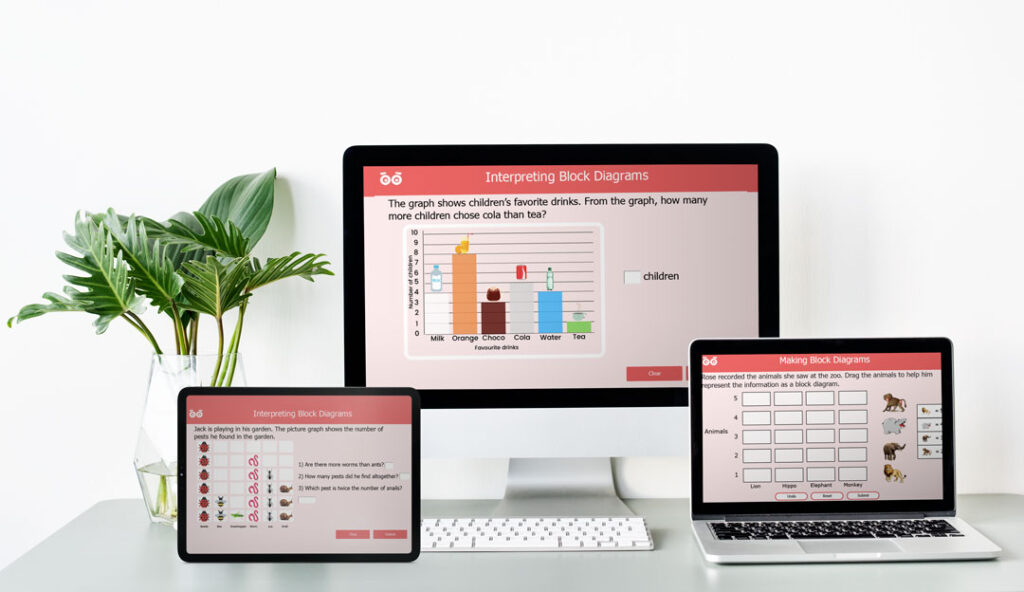
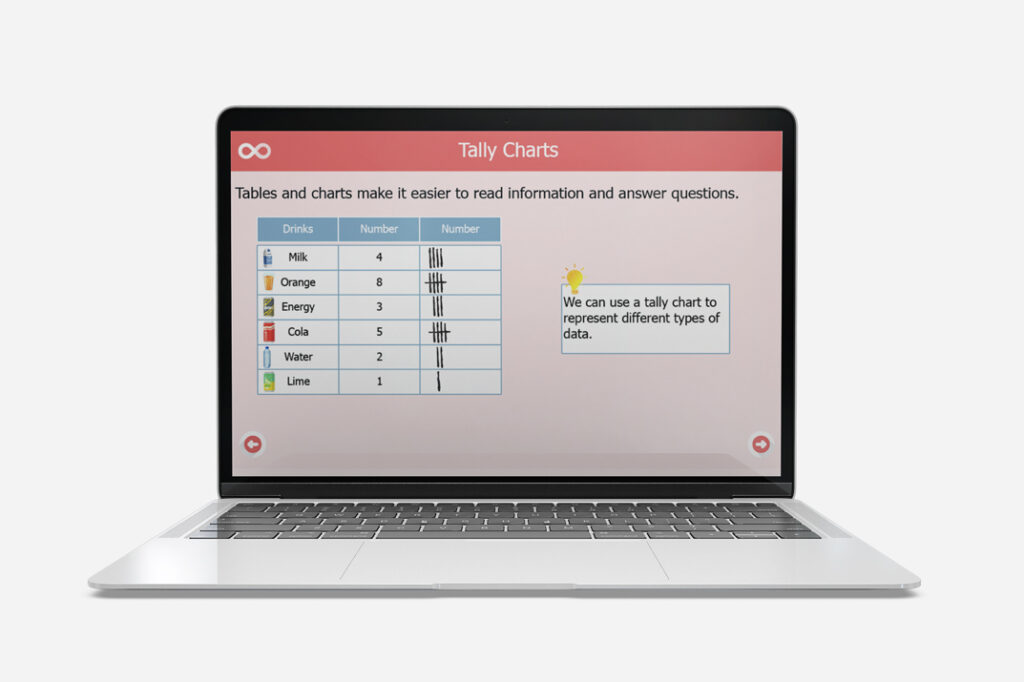
- Ask and answer simple questions by counting the number of objects in each category and sorting the categories by quantity.
- Ask-and-answer questions about totalling and comparing categorical data.
Target Ages
- Age: 5-7
- England & Wales: Year 1-2
- Scotland: Primary 1-2
- Rep. Ireland: Sr. Infants-1st class
- Australia: Kindergarten-First grade
- USA: Kindergarten-First grade
What's Included
- Three-part Lesson
- Self-marking Activities
- Fluency, Reasoning and Problem-solving Questions.
- Engaging Drag and Drop Activities
- Interactive Self-marking Worksheet
- Printable Worksheets to Consolidate Learning
Video Preview
Connected Resources
Trusted by Educators and Loved by Students Worldwide
Right for my child, the 4th option we've used this year, and my daughter is learning well!

I've used Skoolmaths for 6 months. Engaging, easy to use, and perfect for extra practice. My son loves it!

Skoolmaths offers everything for my classrooms, including engaging digital activities and printable worksheets.

Since subscribing to Skoolmaths, my children have improved greatly with engaging and effective interactive learning materials.

I use the resources primarily for students with learning difficulties, and on the autism spectrum for extra practice and during independent centers.

Choose Your Plan
Maths and Science
£
7
Monthly
99
Monthly
- Access to all subjects
- Downloadable resources
- Progress tracking for one user
Best Value
Maths
£
4
Monthly
99
Monthly
- Access to all Maths Content
- Downloadable resources
- Progress tracking for one user
Science
£
4
Monthly
99
Monthly
- Access to all Science Content
- Downloadable resources
- Progress tracking for one user
Maths and Science
£
12
Monthly
99
Monthly
- Access for multiple users
- Access to all subjects
- Downloadable resources
- Progress tracking for all users
Best Value
Maths
£
7
Monthly
99
Monthly
- Access for multiple users
- Access to all Maths Content
- Downloadable resources
- Progress tracking for all users
Science
£
7
Monthly
99
Monthly
- Access for multiple users
- Access to all Science Content
- Downloadable resources
- Progress tracking for all users
