One-time purchase. Instant digital download.
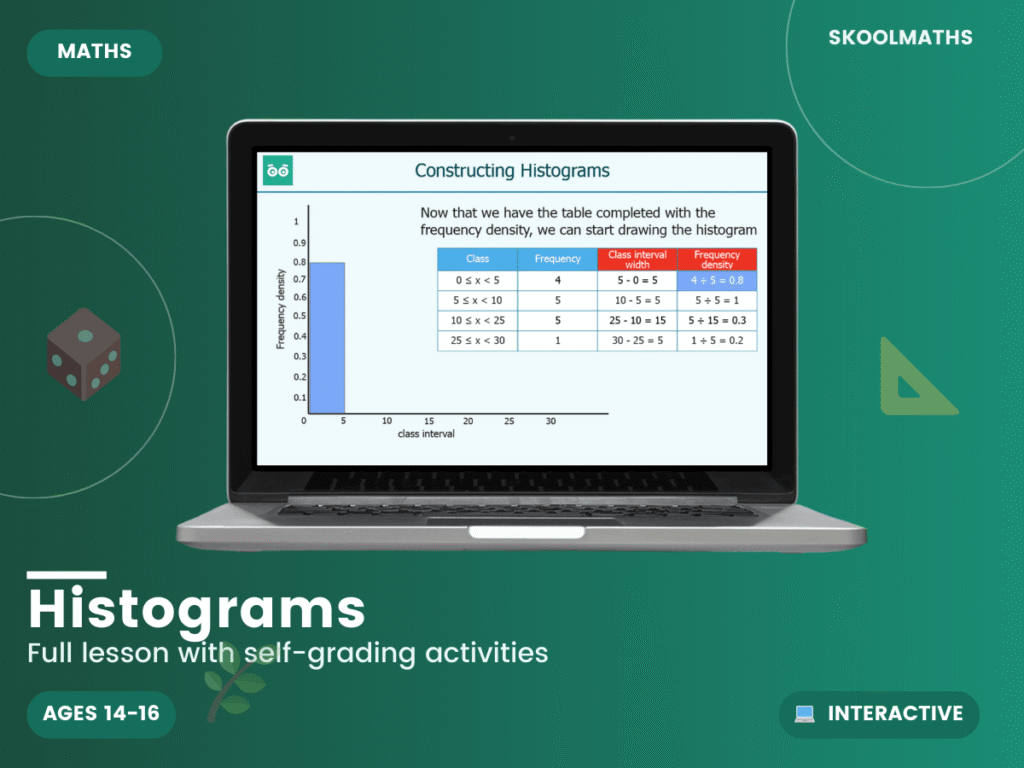
Do your students plot frequency instead of frequency density? This 30-slide interactive lesson teaches histograms with unequal class intervals, from the key formula to worked examples.
Students learn the concept of a histogram and its role in displaying a data distribution, then the key formula: frequency density = frequency ÷ class width. They construct histograms from a table, interpret them by reading the class interval on the horizontal axis and the frequency density on the vertical axis, find missing frequencies or class intervals, and estimate the mean by using the midpoint of each class interval.
A dependable addition to a GCSE statistics topic, giving students a clear method for a topic that regularly appears on higher papers. Secure understanding of frequency density here supports work on probability from histograms.
Build confident histogram skills today — Add to Basket.
What year group is this for? Years 9–11 (ages 13–16), GCSE.
Does it cover unequal class intervals? Yes — it teaches frequency density for unequal class widths.
Is it self-marking? Yes, with instant feedback on the questions.
| Year Groups | Year 9–11 |
|---|---|
| Resource Type | 🎓 Interactive Lesson & Activities |
| Format | Digital Only |
| Curriculum | England & Wales — KS3–KS4 (Years 9–11) |
| Added | 22 February 2022 |
Membership unlocks this resource plus every lesson, worksheet and activity — all subjects, all year groups, all in one place.


Reviews
There are no reviews yet.