One-time purchase. Instant digital download.
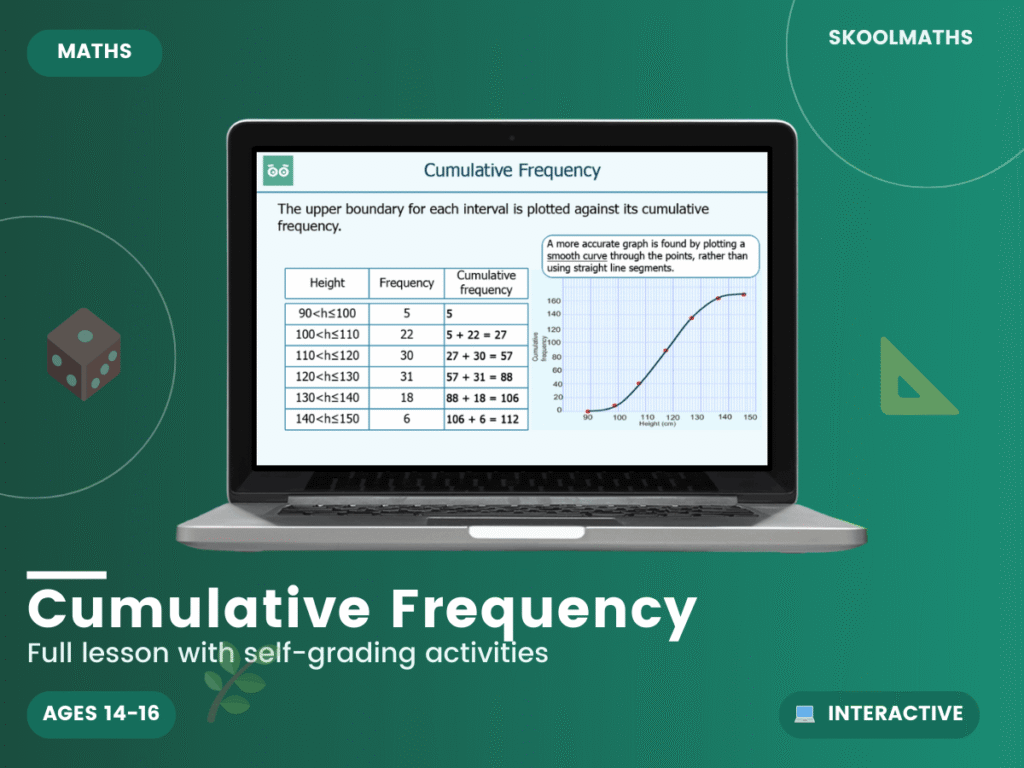
Do your students plot the wrong values on a cumulative frequency graph? This 19-slide interactive lesson teaches cumulative frequency from the table to the curve.
Students learn to calculate and complete a cumulative frequency table by adding each frequency to the running total, checking that the final value equals the total frequency. They then construct the graph by plotting the upper boundary of each class interval against its cumulative frequency, joining the points with a smooth curve, and use the graph to find an estimate of the median. Worked examples use data such as students’ heights and hours worked.
A dependable addition to a GCSE statistics topic, giving students a clear method for a graph type that often costs marks. Confidence here also supports work on box plots and comparing distributions.
Build confident statistics skills today — Add to Basket.
What year group is this for? Years 10–11 (ages 14–16), GCSE.
Does it cover estimating the median? Yes — students use the graph to estimate the median.
Is it self-marking? Yes, with instant feedback on the questions.
| Year Groups | Year 10–11 |
|---|---|
| Resource Type | 🎓 Interactive Lesson & Activities |
| Format | Digital Only |
| Curriculum | England & Wales — KS4 (Years 10–11) |
| Added | 4 March 2026 |
Membership unlocks this resource plus every lesson, worksheet and activity — all subjects, all year groups, all in one place.




Reviews
There are no reviews yet.