One-time purchase. Instant digital download.
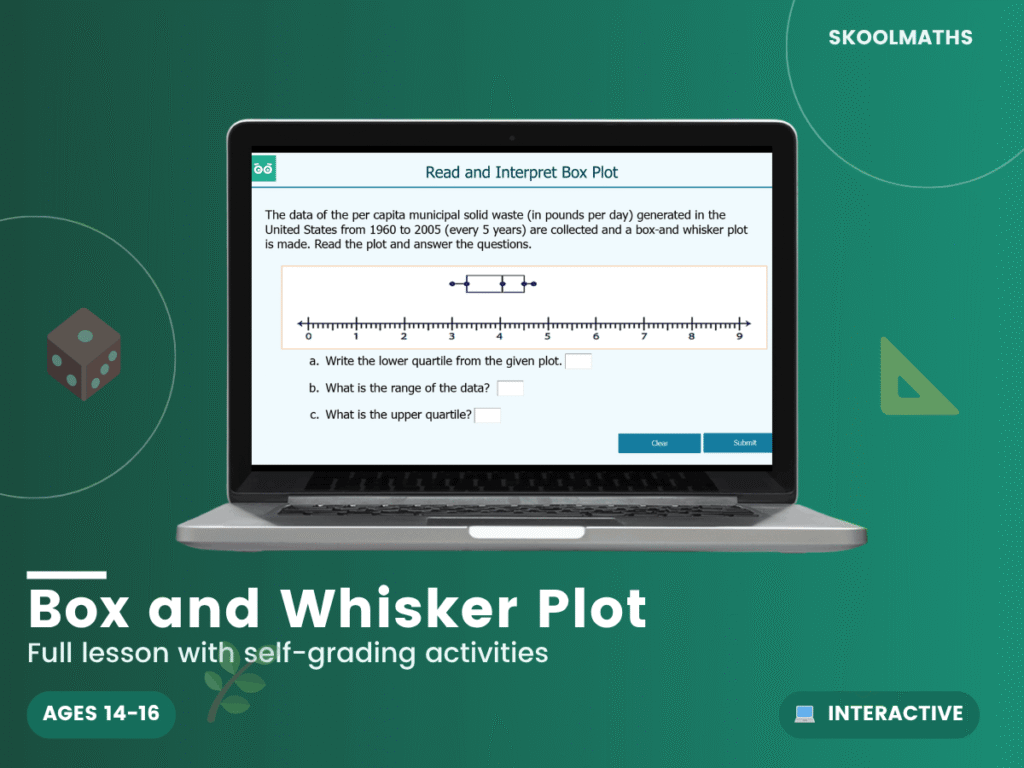
Can your students read a box plot at a glance? This 29-slide interactive lesson teaches box and whisker plots from the five-number summary to reading and comparing them.
Students learn what a box and whisker plot is and identify its five key values, then calculate the five-number summary: the minimum, lower quartile, median, upper quartile and maximum. They are shown that ordering the data first is the most important step before finding any quartiles, since the median splits the data in half and the lower quartile splits the lower half. They then read a box plot, matching each part of the diagram to its value in the five-number summary.
A dependable addition to a GCSE statistics topic, giving students a clear route from raw data to a finished box plot. Confidence here supports comparing distributions and interpreting spread.
Build confident statistics skills today — Add to Basket.
What year group is this for?
Years 10–11 (ages 14–16), GCSE.
Does it cover the interquartile range?
Yes — as part of the five-number summary.
Is it self-marking?
Yes, with instant feedback on the questions.
| Year Groups | Year 10–11 |
|---|---|
| Resource Type | 🎓 Interactive Lesson & Activities |
| Format | Digital Only |
| Curriculum | England & Wales — KS4 (Years 10–11) |
| Added | 22 April 2019 |
Verified reviews left by teachers who bought this resource on our TES and Teachers Pay Teachers stores.
a helpful resource but some answers were not quite right
Membership unlocks this resource plus every lesson, worksheet and activity — all subjects, all year groups, all in one place.

Reviews
There are no reviews yet.