Skip to content

Probability And Sample Space Diagrams — Interactive Lesson (KS4)

☆☆☆☆☆ Add your review • Year 10–11 • 🎓 Interactive Lesson & Activities
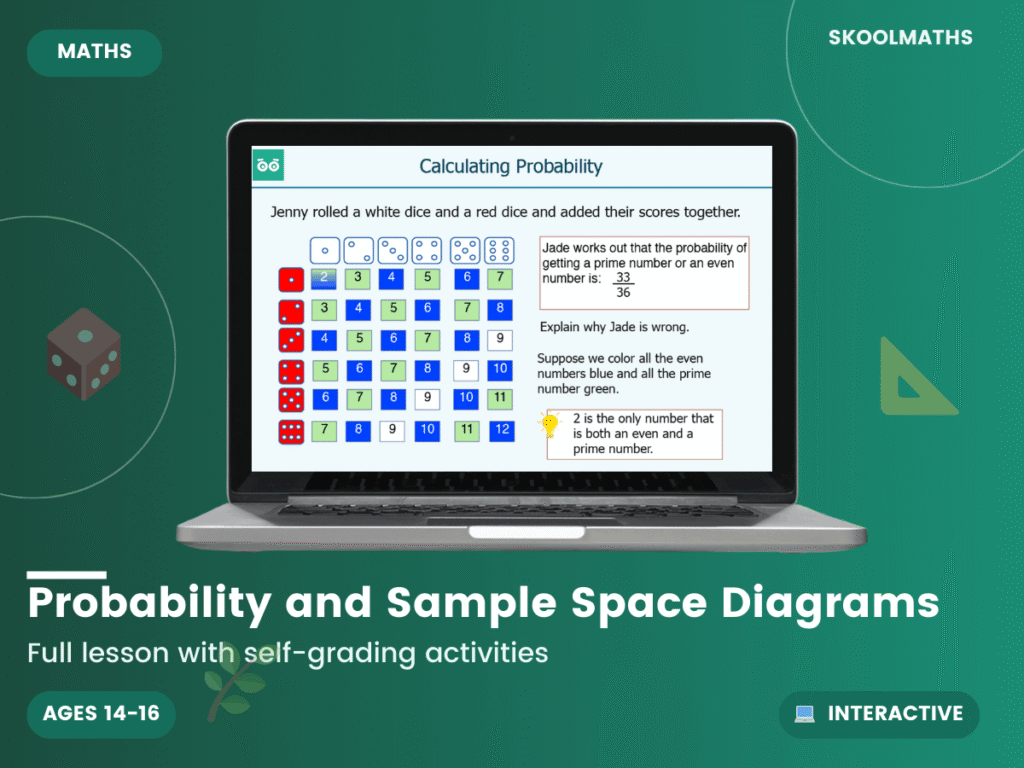
Sample Space Diagrams is designed to teach learners how to list the outcomes of two events using systematic listings and use this to find probability.

Included in every Skoolmaths plan

  • This resource plus every lesson, worksheet and game in its year group
  • Interactive lessons that mark answers and read aloud
  • New resources added every month
⭐ Get every resource with a Skoolmaths plan

or buy just this resource for £3.75

✅ Instant Access
💻 Any Device
🔒 Secure Checkout
♻️ Use Anytime

Sample Space Diagrams is a fully interactive lesson for GCSE (1–9) learners.

Learning Objectives

  • List the outcomes of one or more events using systematic listing
  • Use sample space diagrams to find the probability of two events

The lesson covers systematic listing, two-way tables, and probability tree diagrams, worked through dice, coin and spinner examples with drag-and-drop and fill-in-the-blank questions and instant feedback.

What’s Inside

  • 27 interactive slides
  • Drag-and-drop activities and interactive worksheets with instant feedback
  • Worked examples using coins, dice and spinners

Teachers can use this for whole-class teaching; learners can also use it at home for practice and revision.

Year Groups Year 10–11
Resource Type 🎓 Interactive Lesson & Activities
Format Digital Only
Curriculum England & Wales — KS4 (Years 10–11)
Added 17 July 2020

Reviews

There are no reviews yet.

Add your review

Your email address will not be published. Required fields are marked *

🎓 Get every resource for one low price

Membership unlocks this resource plus every lesson, worksheet and activity — all subjects, all year groups, all in one place.
View Membership Plans →