One-time purchase. Instant digital download.
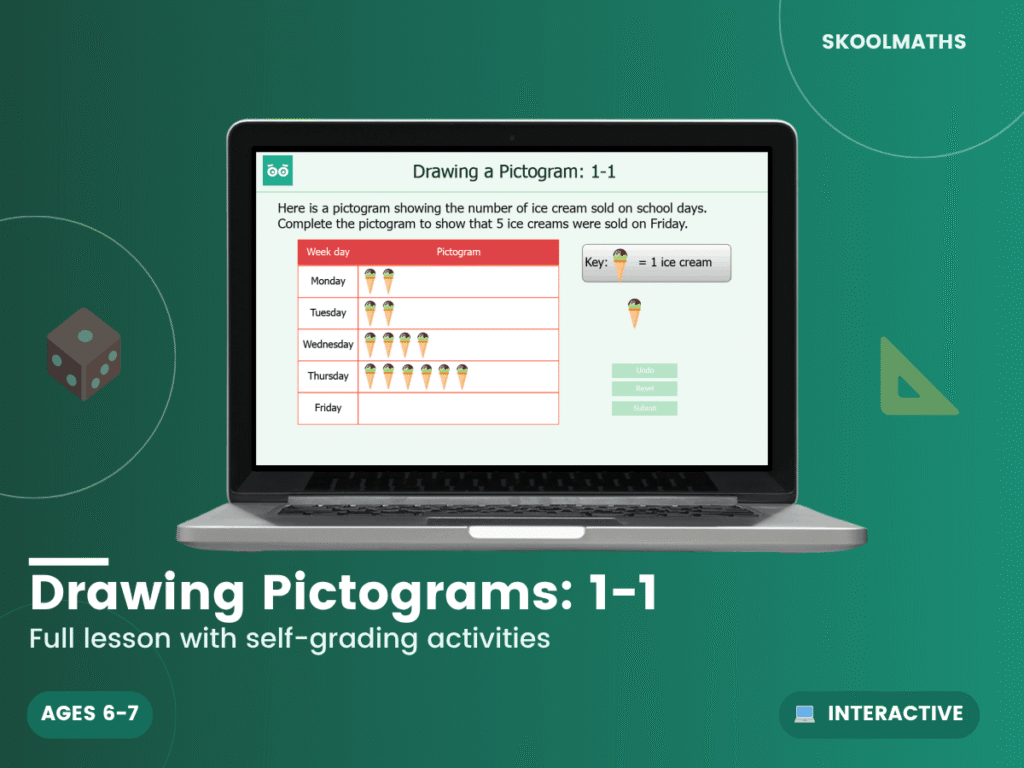
Does every picture need to stand for exactly one item? This 12-slide interactive lesson teaches drawing pictograms using one-to-one correspondence.
Pupils learn to understand a pictogram as a way of representing data, draw a pictogram using one-to-one correspondence where each symbol represents one item, and understand that the same symbol must be used for every category. They complete a pictogram of ice creams sold on school days, draw one showing the number of pets owned by friends, and use a tally chart to complete a pictogram of favourite drinks. A key, such as one symbol representing one pet, is given for every pictogram.
A dependable addition to a Year 2 statistics topic, giving pupils a careful, one-to-one introduction to pictograms before symbols represent larger amounts. Getting this key idea right here avoids confusion later with scaled pictograms.
Build confident data skills today — Add to Basket.
What year group is this for?
Year 2 (ages 6–7), KS1.
Does one symbol always mean one item?
Yes — this lesson focuses on one-to-one correspondence.
Is it self-marking?
Yes, with instant feedback on the questions.
| Year Group | Year 2 Maths |
|---|---|
| Resource Type | 🎓 Interactive Lesson & Activities |
| Format | Digital Only |
| Curriculum | England & Wales — KS1 (Year 2) |
| Added | 4 March 2026 |
Membership unlocks this resource plus every lesson, worksheet and activity — all subjects, all year groups, all in one place.

Reviews
There are no reviews yet.