One-time purchase. Instant digital download.
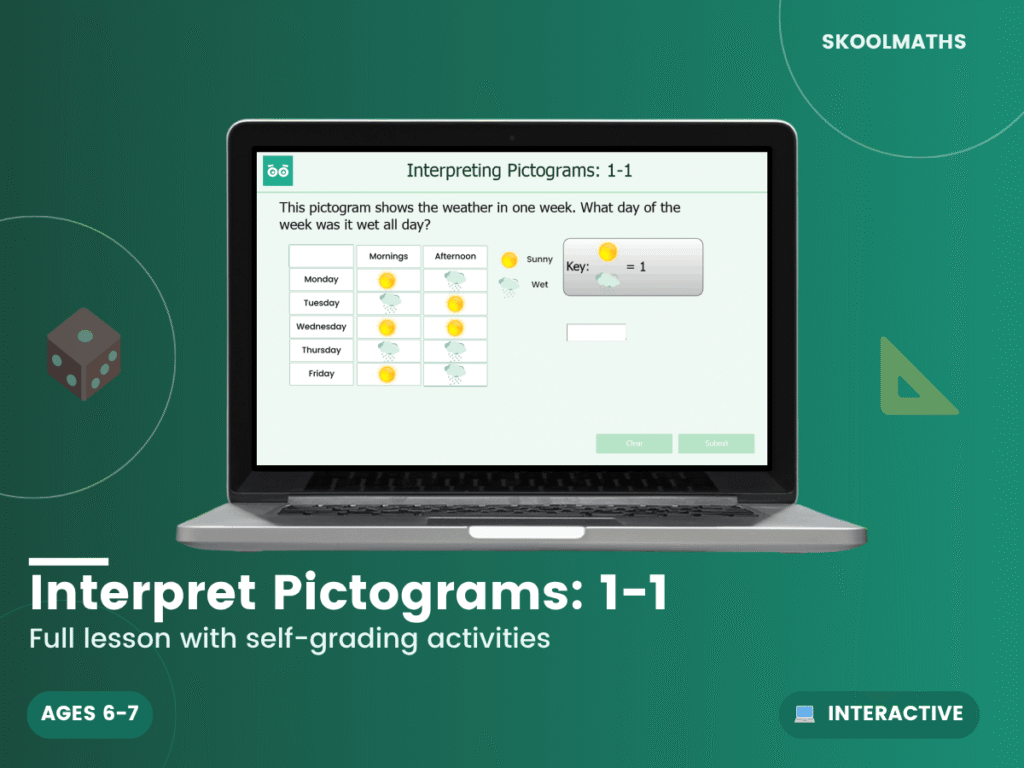
How many more cars were recorded on Friday than Monday? This 31-slide interactive lesson teaches interpreting pictograms, always starting with the key.
Pupils learn to interpret and present data using pictograms, and to solve one-step and two-step questions using the information shown. They start with a key such as one picture representing one car, then use pictograms about a week of weather and cars recorded on different days to answer questions such as which day was wet all day or how many more cars appeared on one day than another. A book-token problem asks pupils to work out which two classes combined their tokens to reach a given total.
A dependable addition to a Year 2 statistics topic, giving pupils practice reading pictograms accurately before scaled symbols are introduced. Confident one-to-one reading here supports the jump to symbols worth 2, 5 or 10 later on.
Build confident data skills today — Add to Basket.
What year group is this for?
Year 2 (ages 6–7), KS1.
Does it cover two-step questions?
Yes — alongside simpler one-step questions.
Is it self-marking?
Yes, with instant feedback on the questions.
| Year Group | Year 2 Maths |
|---|---|
| Resource Type | 🎓 Interactive Lesson & Activities |
| Format | Digital Only |
| Curriculum | England & Wales — KS1 (Year 2) |
| Added | 4 March 2026 |
Membership unlocks this resource plus every lesson, worksheet and activity — all subjects, all year groups, all in one place.



Reviews
There are no reviews yet.