One-time purchase. Instant digital download.
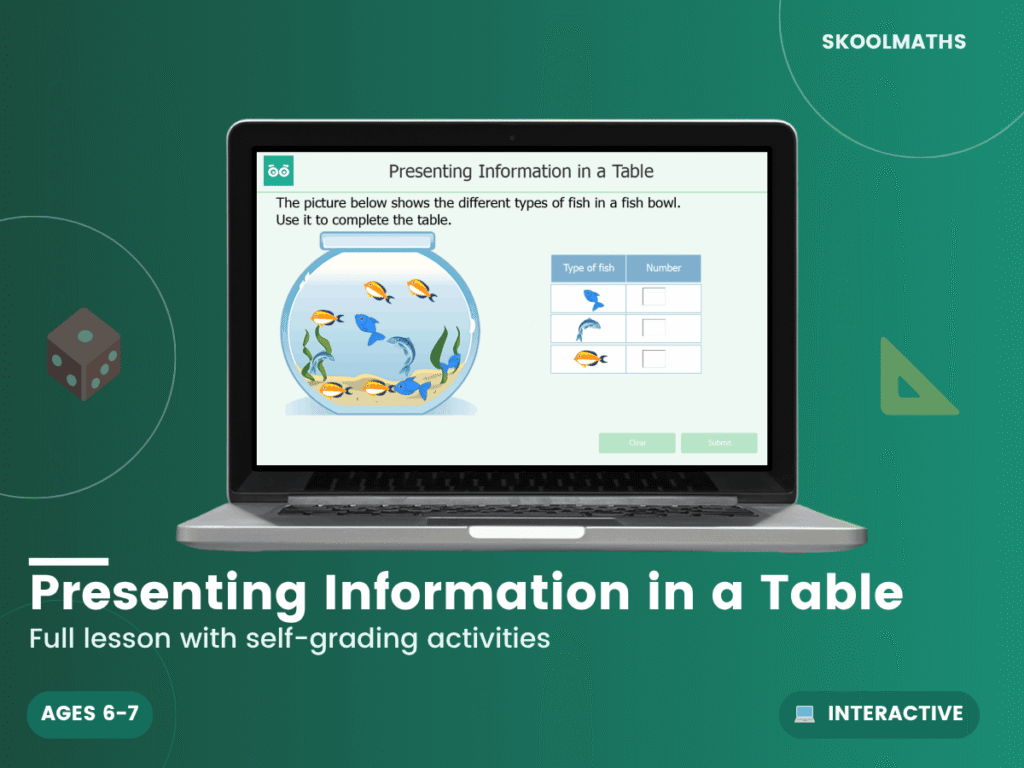
Which drink is the most popular? This 20-slide interactive lesson teaches presenting information in a table, using real-world data pupils can relate to.
Pupils practise creating and interpreting tables using real-world data, solve one-step questions using information presented in tables, and construct simple tables from given information. Using a table of children’s favourite drinks, they find the most popular drink, work out how many more children chose one drink over another, and compare the same information shown as a table and as a graph, checking that both give the same answer.
A dependable addition to a Year 2 statistics topic, giving pupils practice reading and building tables before moving on to tally charts and pictograms. Comparing a table to its matching graph here builds a flexible understanding of data handling.
Build confident data skills today — Add to Basket.
What year group is this for?
Year 2 (ages 6–7), KS1.
Does it link tables to graphs?
Yes — pupils compare the same data shown both ways.
Is it self-marking?
Yes, with instant feedback on the questions.
| Year Group | Year 2 Maths |
|---|---|
| Resource Type | 🎓 Interactive Lesson & Activities |
| Format | Digital Only |
| Curriculum | England & Wales — KS1 (Year 2) |
| Added | 4 March 2026 |
Membership unlocks this resource plus every lesson, worksheet and activity — all subjects, all year groups, all in one place.

Reviews
There are no reviews yet.