One-time purchase. Instant digital download.
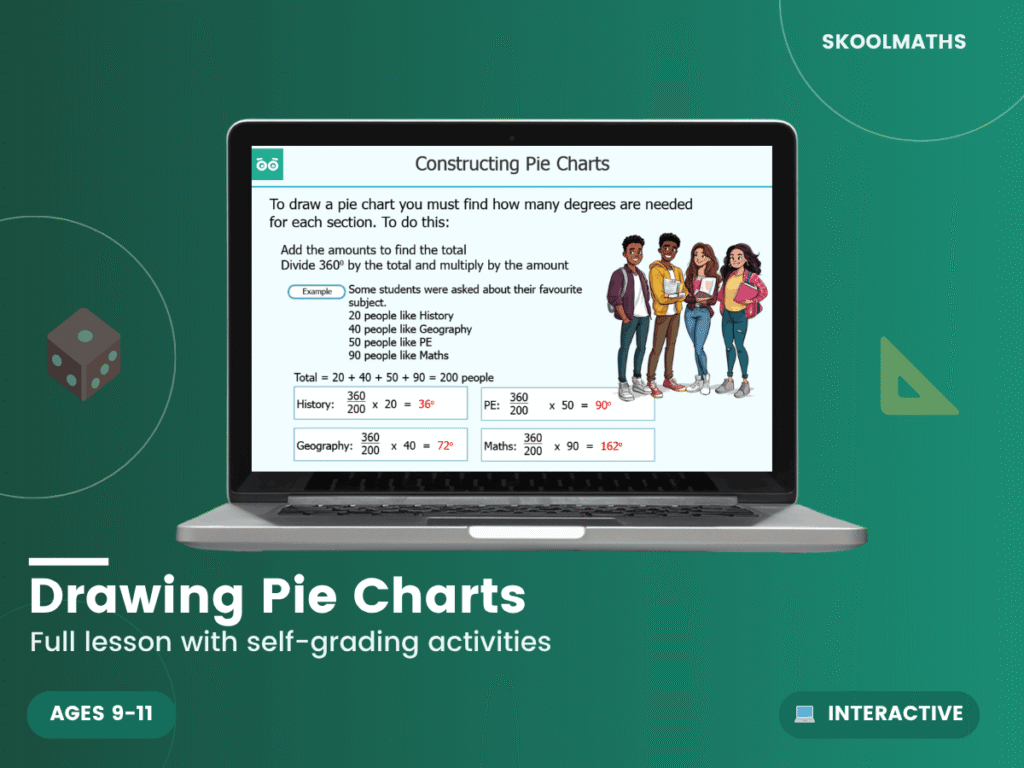
Is converting survey data into an accurate pie chart still a sticking point for your class? This 17-slide interactive lesson guides pupils step by step through the full construction process from real data, using sectors, percentages and degrees, with nothing to prepare beforehand.
Pupils work through converting survey-style data into accurate sectors, using percentages and the 360 degrees in a full turn — core skills within the Year 6 National Curriculum area of statistics. Working through the whole process, from raw data to a finished sector, ties the percentage and angle calculations together rather than teaching them in isolation.
Add to Basket today.
What year group is this for? Year 6 (ages 10–11).
Does it use real data? Yes, survey-style data such as favourite categories.
Is it self-marking? Yes, instant feedback throughout.
| Year Group | Year 6 Maths |
|---|---|
| Resource Type | 🎓 Interactive Lesson & Activities |
| Format | Digital Only |
| Curriculum | England & Wales — KS2 (Year 6) |
| Added | 4 March 2026 |
Membership unlocks this resource plus every lesson, worksheet and activity — all subjects, all year groups, all in one place.

Reviews
There are no reviews yet.