One-time purchase. Instant digital download.
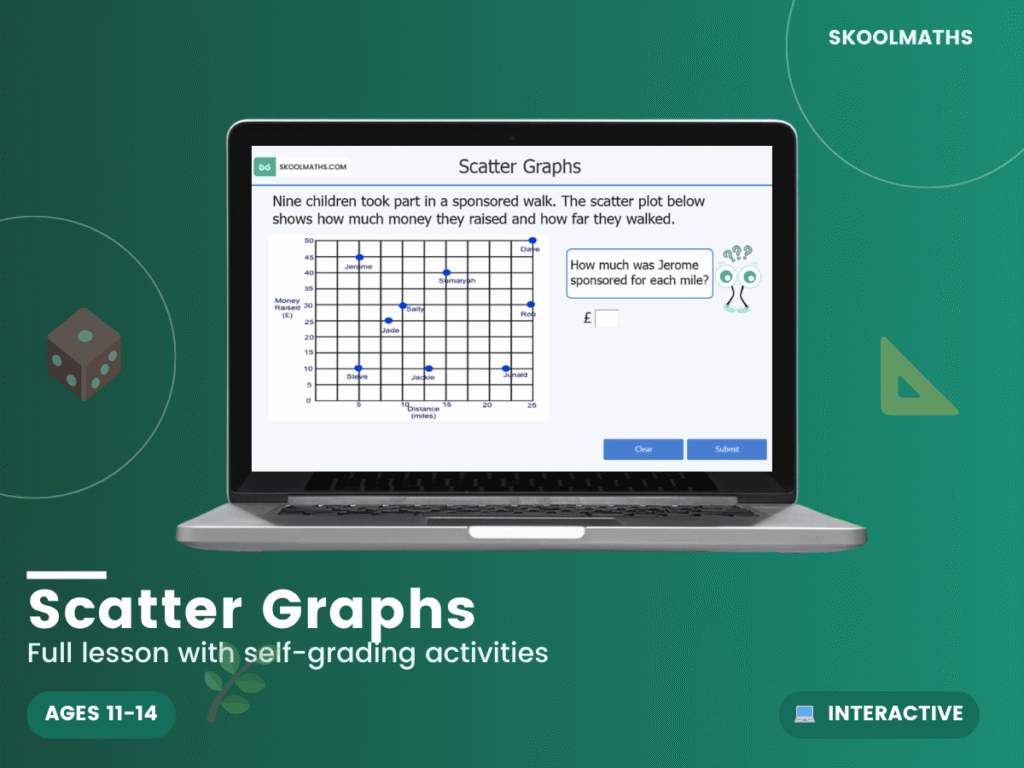
How far did Sally walk? This 19-slide interactive lesson teaches KS3 students to read and plot scatter graphs using real-life data.
Students learn that scatter graphs compare the relationship between two sets of data, and that they are a useful way of showing paired data. They use and read information from them, and plot simple graphs for a given set of data. Examples include shoe size and height, weight, temperature and ice cream sold, a sponsored walk in which nine children raised money for the miles they walked, and the weight and shoe size of eight students.
A dependable addition to a KS3 statistics topic, giving students a clear introduction to scatter graphs before they meet correlation and lines of best fit at GCSE. Reading graphs accurately is a skill they will use across the curriculum.
Build confident data skills today — Add to Basket.
What year group is this for? KS3 — Years 7–9 (ages 11–14).
Does it cover plotting? Yes — students plot simple scatter graphs from data.
Is it self-marking? Yes, with instant feedback on the questions.
| Year Groups | Year 7–9 |
|---|---|
| Resource Type | 🎓 Interactive Lesson & Activities |
| Format | Digital Only |
| Curriculum | England & Wales — KS3 (Years 7–9) |
| Added | 4 March 2026 |
Membership unlocks this resource plus every lesson, worksheet and activity — all subjects, all year groups, all in one place.


Reviews
There are no reviews yet.