Skip to content

Histograms — Interactive Lesson (Ages 13–16)

☆☆☆☆☆ Add your review • Year 9–11 • 🎓 Interactive Lesson & Activities
A 30-slide interactive GCSE lesson on histograms with unequal class intervals: frequency density, constructing, interpreting and estimating the mean.

Included in every Skoolmaths plan

  • This resource plus every lesson, worksheet and game in its year group
  • Interactive lessons that mark answers and read aloud
  • New resources added every month
⭐ Get every resource with a Skoolmaths plan

or buy just this resource for €4.24

✅ Instant Access
💻 Any Device
🔒 Secure Checkout
♻️ Use Anytime

Lesson at a glance

What pupils will learn

  • Students will be able to understand the concept of histograms and their role in displaying data distributions.
  • Students will be able to construct and interpret histograms for different sets of data with unequal class intervals.
  • Students will be able to analyze and draw conclusions from the information presented in histograms.
  • Students will be able to find missing information and work out the mean estimate from the midpoint.

Curriculum

UK
Year 9–11 Maths, National Curriculum (England)
Topic area
Statistics
US equivalent
Grades 8–10 (year level only; not mapped to US standards)

What the lesson covers

  • The Key Formula for Histograms
  • Finding Missing Information from a Histogram
  • Interpreting Histograms
  • Estimating the Mean from a Histogram

How it is interactive

  • 10 fill-in-the-blank questions
  • 6 embedded interactive activities
  • 4 multiple-choice questions
  • 2 sentence-writing tasks
  • 1 sorting and ordering task

Feedback and what you get

Questions are marked automatically as pupils answer: a sound and a character reaction show straight away whether they are right, and correct answers earn points, with a results screen at the end. Sentence-writing tasks are for pupils' own answers and are not marked automatically.

A 30-slide interactive lesson that runs in any web browser on a computer, tablet or interactive whiteboard. Members open it online from their year group page. Buying it on its own gives you a .zip download to unzip and open.

Free preview: try the first slides before you decide. Included in every Skoolmaths plan.

Do your students plot frequency instead of frequency density? This 30-slide interactive lesson teaches histograms with unequal class intervals, from the key formula to worked examples.

Mastering Histograms at GCSE

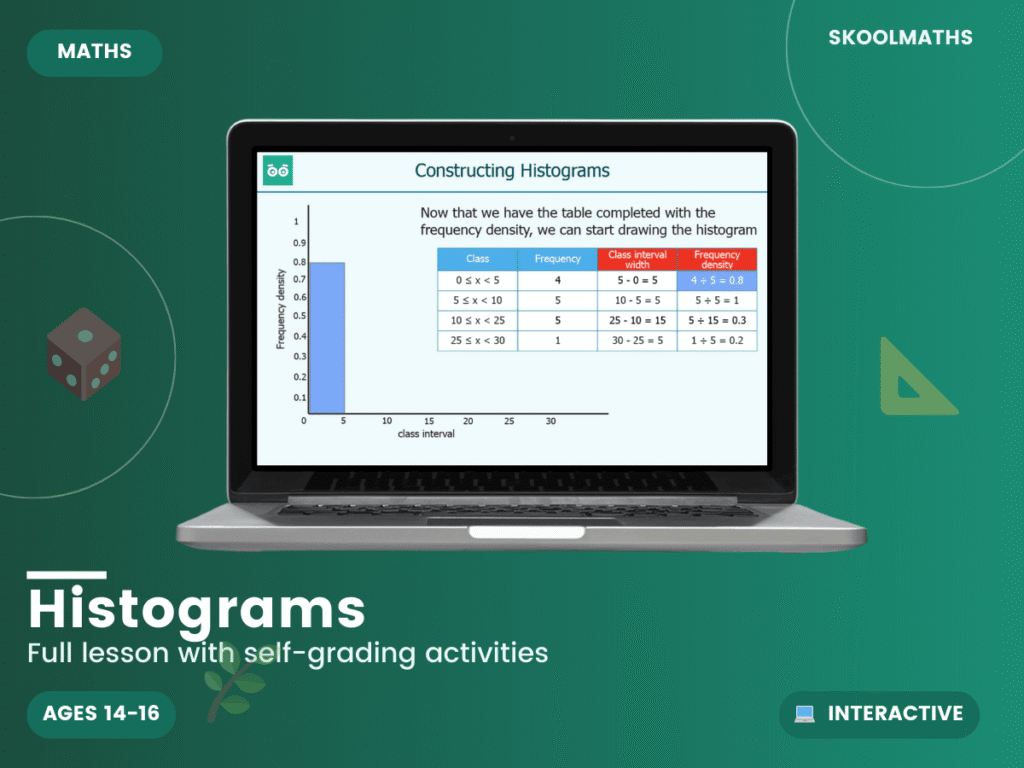
Students learn the concept of a histogram and its role in displaying a data distribution, then the key formula: frequency density = frequency ÷ class width. They construct histograms from a table, interpret them by reading the class interval on the horizontal axis and the frequency density on the vertical axis, find missing frequencies or class intervals, and estimate the mean by using the midpoint of each class interval.

What’s Included

  • 30-slide interactive lesson on histograms
  • Learning objectives on constructing, interpreting and using histograms
  • The key formula linking frequency, class width and frequency density
  • Worked examples, including finding missing frequencies
  • Ten fill-in-the-blank tasks plus quiz and sorting activities with instant feedback

Key Benefits for Students

  • Makes frequency density and unequal class widths clear
  • Covers both constructing and interpreting histograms
  • Shows how to estimate the mean from a histogram
  • Instant feedback on answer questions

Why Teachers Love It

  • No prep — ready for whole-class teaching on an interactive whiteboard
  • A long, structured lesson that can be split across sessions
  • Self-marking questions support independent practice
  • Suits teaching, revision and homework
  • Targets one of the most commonly missed GCSE statistics topics

Love this? You’ll love…

A dependable addition to a GCSE statistics topic, giving students a clear method for a topic that regularly appears on higher papers. Secure understanding of frequency density here supports work on probability from histograms.

Build confident histogram skills today — Add to Basket.

FAQ

What year group is this for? Years 9–11 (ages 13–16), GCSE.

Does it cover unequal class intervals? Yes — it teaches frequency density for unequal class widths.

Is it self-marking? Yes, with instant feedback on the questions.

Year GroupsYear 9–11
Resource Type🎓 Interactive Lesson & Activities
FormatDigital Only
CurriculumEngland & Wales — KS3–KS4 (Years 9–11)
Added22 February 2022

Reviews

There are no reviews yet.

Add your review

Your email address will not be published. Required fields are marked *

🎓 Get every resource for one low price

Membership unlocks this resource plus every lesson, worksheet and activity — all subjects, all year groups, all in one place.
View Membership Plans →

Free: our First Two Weeks Starter Pack

Eight print-and-go pages for a calm start with a new class, plus new lessons as we add them. About two emails a month.