Sample Space Diagrams
£2.69
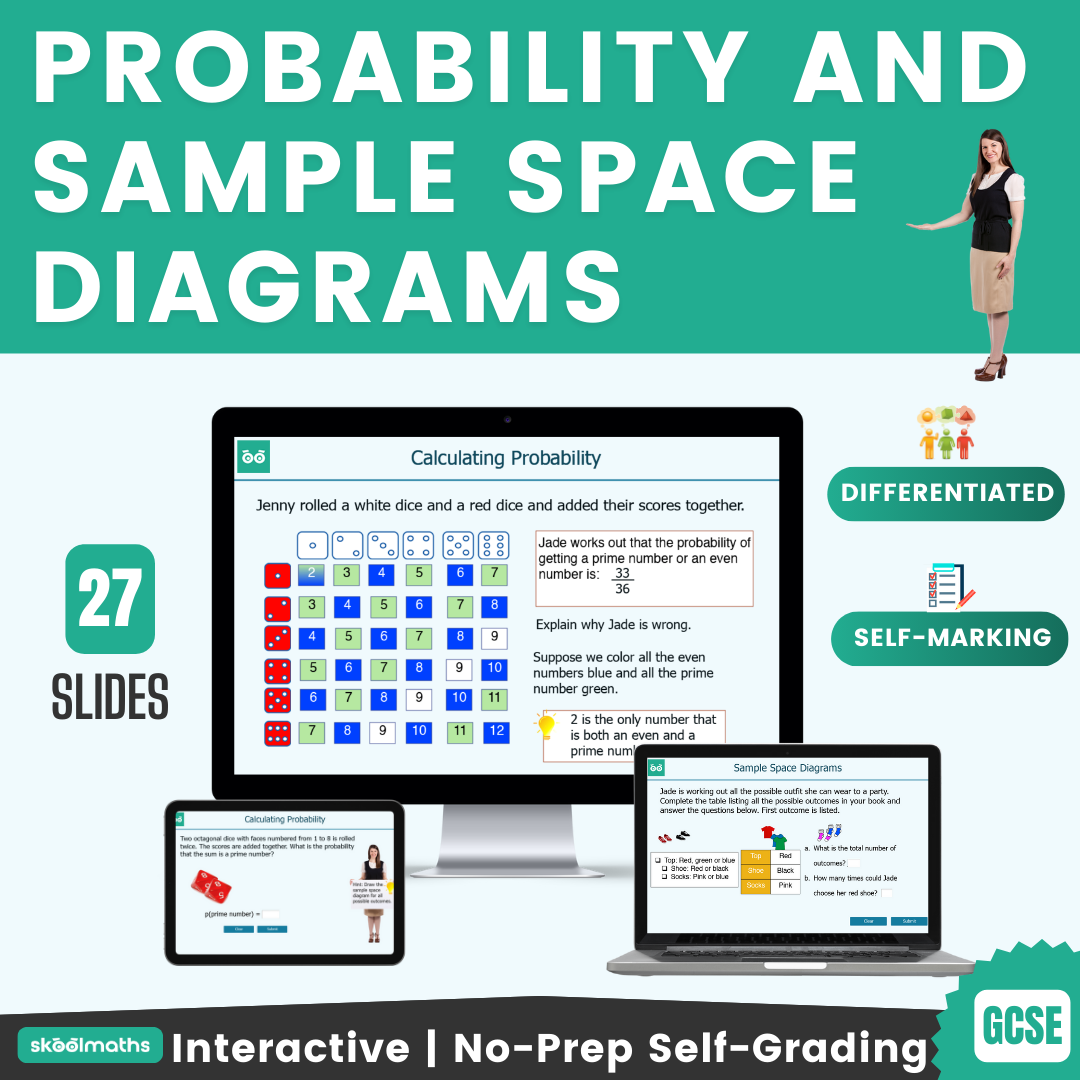
Sample Space Diagrams is designed to teach learners how to list the outcomes of two events using systematic listings and use this to find probability.
Description
Sample Space Diagrams is a completely interactive lesson designed for learners taking GCSE (1-9).
Learning Objectives:
-
to be able to list the outcomes of one or more events using systematic listings;
-
and use this to find probability from two events.
Teachers can use the lesson for whole-class teaching. Learners can also use it at home for practice and revisions.
There are lots of drag and drop activities as well as interactive worksheets with instant feedback.
The lesson contains 26 interactive slides in stunning design and dynamic graphics that will engage your learners.
Other topics in this category include
-
systematic listing strategies
-
estimating powers and roots of any given positive number
-
indices
-
surds
-
fractional indices
-
standard form
-
recurring decimals
-
ratio and proportions
-
rounding and estimations
-
simplify and manipulate algebraic expressions
-
algebraic fractions
-
factorising quadratic expressions of the form x2 + bx + c
-
the difference of 2 squares
-
factorising quadratic expressions of the form ax2 + bx + c
-
simplifying expressions involving sums, products and powers
-
laws of indices
-
parallel and perpendicular lines
-
the equation of the line segment
-
quadratic equations
-
trial and improvement
-
translate simple situations or procedures into algebraic expressions or formulae; derive an equation (or 2
-
simultaneous equations
-
linear inequalities
-
quadratic inequalities
-
linear sequences
-
quadratic sequences
Ratio, proportion and rates of change
-
compound measures
-
the gradient of a straight line
-
direct and inverse proportion
Geometry and measures
-
Transformations
-
Circle definitions and properties
-
Circle theorems
-
Plans and elevations
-
Arc lengths sector area
-
surface areas and volumes
-
Congruence and similarity
-
Pythagoras’ Theorem
-
Trigonometry
-
sine rule and cosine rule
-
translations as 2D vectors
-
Addition and subtraction of vectors
-
multiplication of vectors by a scalar
-
diagrammatic and column representations of vectors
Probability
-
probabilities of mutually exclusive events
-
probability of independent and dependent events
-
Conditional probabilities with two-way tables
-
Conditional probabilities with tree diagrams
-
Conditional probabilities with Venn diagrams
Statistics
-
Tables and line graphs
-
Histograms
-
cumulative frequency graphs
-
Box and whisker plots
-
Measures of central tendency
-
Quartiles and inter-quartile range
-
Scatter graphs


