One-time purchase. Instant digital download.
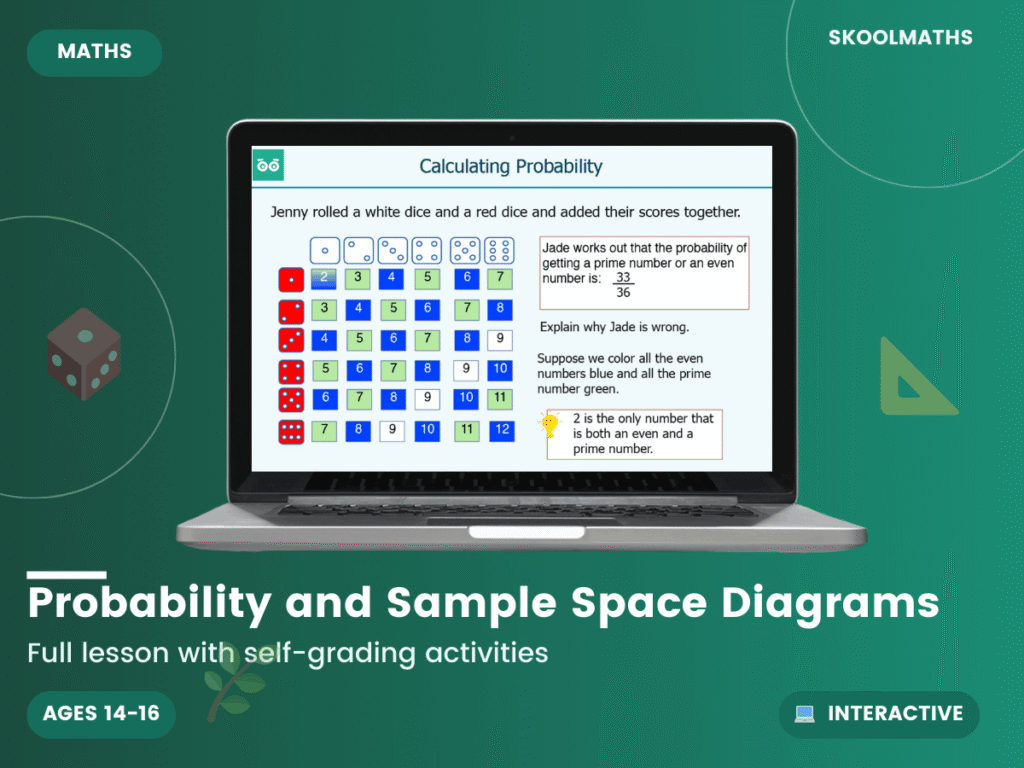
This Sample Space Diagrams and Probability lesson teaches students to list every possible outcome of an experiment systematically, using a sample space diagram. Across 27 slides, a two-coin toss example builds a grid of outcomes — HH, HT, TH and TT — showing students exactly how a sample space diagram organises every combination of two events.
Building on this systematic listing method, the lesson then shows students how to use their completed sample space diagram to calculate the probability of different outcomes, linking the organisational skill directly to real probability calculations.
By the end of the lesson, students will be able to list all possible outcomes of an experiment using sample space diagrams, and use these diagrams to calculate probabilities — core GCSE probability skills that come up frequently in exam questions involving two independent events.
Sample space diagrams are a recurring tool at GCSE, used again for tree diagrams and Venn diagrams later in the course, so a secure grasp of this systematic listing method pays off well beyond this one topic.
The lesson is fully interactive and self-marking, giving instant feedback on every question, so it’s suited to whole-class teaching, independent revision or homework.
| Year Groups | Year 10–11 |
|---|---|
| Resource Type | 📋 Lesson Pack |
| Format | Print & Digital |
| Curriculum | England & Wales — KS4 (Years 10–11) |
| Added | 4 March 2026 |
Membership unlocks this resource plus every lesson, worksheet and activity — all subjects, all year groups, all in one place.

Reviews
There are no reviews yet.