Skip to content

Interpreting Time Graphs — Interactive Lesson (Year 4)

☆☆☆☆☆ Add your review • Year 4 Maths • 🎓 Interactive Lesson & Activities
A 20-slide interactive Year 4 lesson on interpreting time graphs, reading distance travelled over time, including stops and journey durations.
£5.00

One-time purchase. Instant digital download.

🎓
Better value with membership Get unlimited access to this and every other resource across all subjects and year groups — for one low monthly price.
⭐ Get Unlimited Access — Members Only
✅ Instant Access
💻 Any Device
🔒 Secure Checkout
♻️ Use Anytime

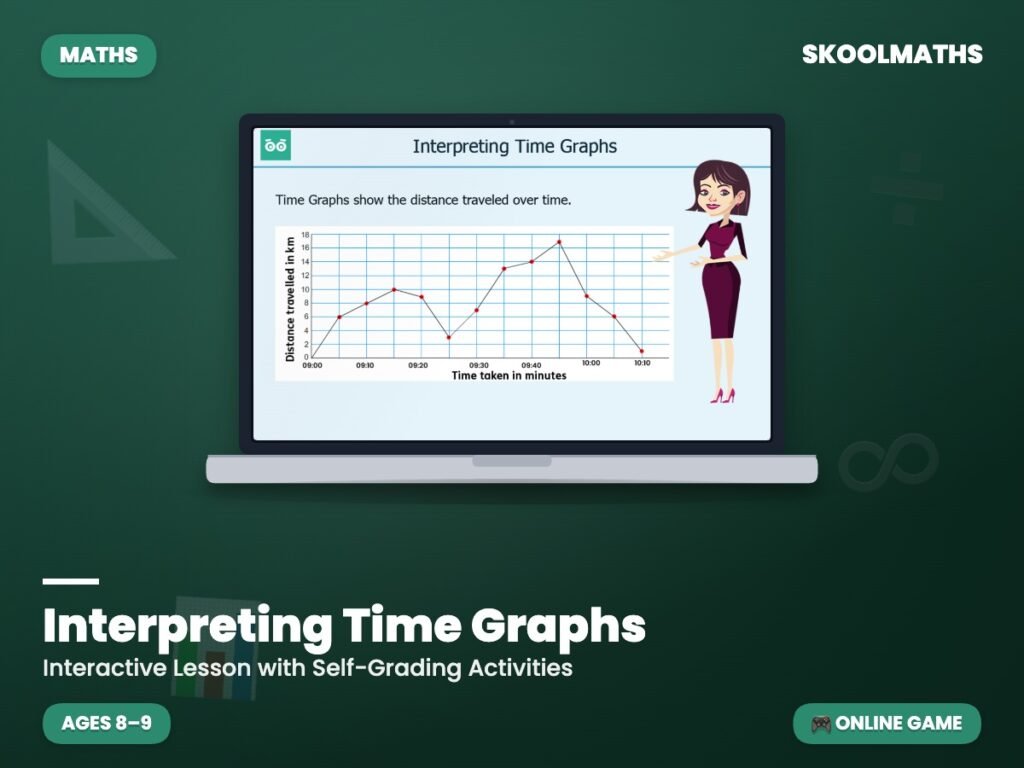
How long did Jessica stop for on her way to work? This 20-slide interactive lesson teaches interpreting time graphs using real journeys pupils can picture.

Mastering Interpreting Time Graphs in Year 4 Maths

Pupils learn to understand how time relates to daily activities, how time can be represented on a graph using appropriate scales, and to interpret information such as start times, end times and durations. Using Jessica’s journey to work, they read how long it takes to travel a given distance, how far her workplace is, and how long she stopped to rest. Further graphs track Andrew’s morning run and a helicopter’s flight from London to Dublin, asking pupils to identify what each axis represents.

What’s Included

  • 20-slide interactive lesson on interpreting time graphs
  • Learning objectives on scales, axes and reading time graphs
  • A worked journey-to-work example with a rest stop
  • Further examples: a morning run and a helicopter flight
  • Fill-in-the-blank and multiple-choice questions with instant feedback

Key Benefits for Students

  • Builds confidence reading both axes of a time graph
  • Explains what a flat section of the graph represents
  • Uses varied, realistic journey contexts
  • Instant feedback on answer questions

Why Teachers Love It

  • No prep — ready for whole-class teaching on an interactive whiteboard
  • A structured lesson that can be split across sessions
  • Self-marking questions support independent practice
  • Suits teaching, revision and homework
  • A dependable foundation before more complex distance-time graphs

Love this? You’ll love…

A dependable addition to a Year 4 statistics and measures topic, giving pupils a clear method for reading real-life journey graphs. Understanding what a flat line means here prepares pupils for speed and distance-time graphs at KS3.

Build confident graph-reading skills today — Add to Basket.

FAQs

What year group is this for?
Year 4 (ages 8–9), KS2.

Does it explain stops on a journey?
Yes — a flat section of the graph shows a rest stop.

Is it self-marking?
Yes, with instant feedback on the questions.

Year GroupYear 4 Maths
Resource Type🎓 Interactive Lesson & Activities
FormatDigital Only
CurriculumEngland & Wales — KS2 (Year 4)
Added4 March 2026

Reviews

There are no reviews yet.

Add your review

Your email address will not be published. Required fields are marked *

🎓 Get every resource for one low price

Membership unlocks this resource plus every lesson, worksheet and activity — all subjects, all year groups, all in one place.

View Membership Plans →