One-time purchase. Instant digital download.
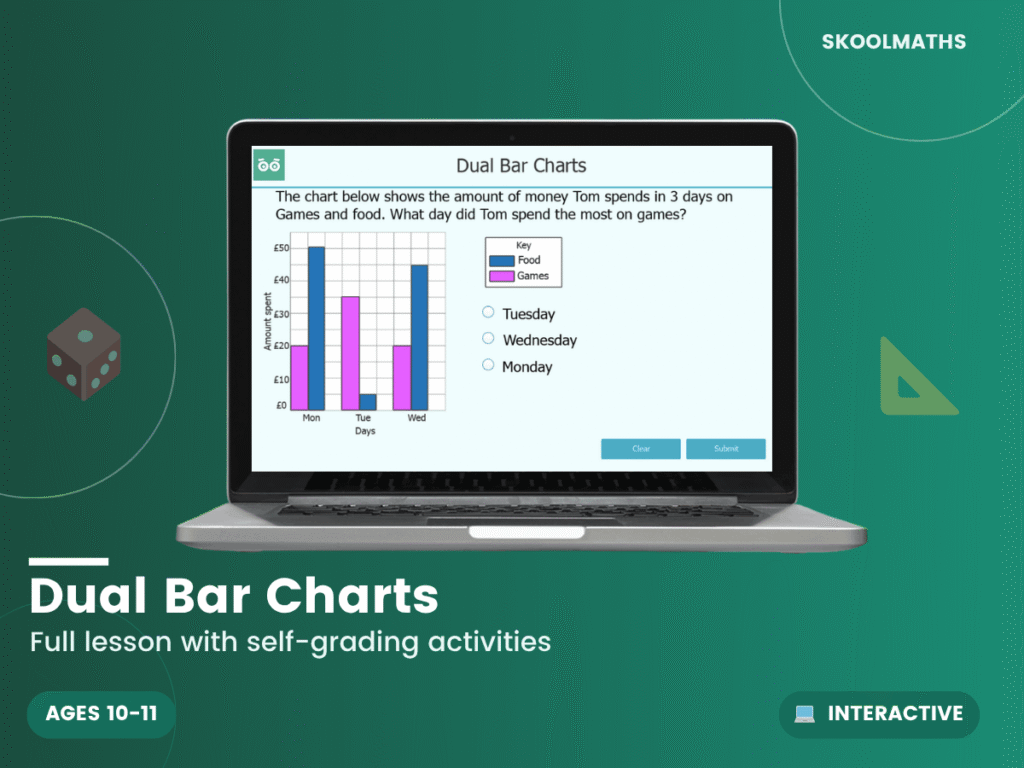
Still explaining how to compare two data sets side by side on the same chart? This substantial 33-slide interactive lesson gives pupils extensive, self-marking practice reading and interpreting dual bar charts.
Pupils practise reading, comparing and interpreting data presented as dual bar charts, building the statistics fluency within the Year 6 National Curriculum area of statistics. Comparing two data sets at once is a genuine step up from single bar charts, and the substantial slide count gives pupils plenty of guided practice before working independently.
Together with the pie chart and averages lessons above, this builds a genuinely rounded Year 6 statistics unit covering several ways of presenting and comparing data, rather than teaching each chart type in isolation from the others.
Add to Basket today.
What year group is this for? Year 6 (ages 10–11).
What does it teach? Reading and comparing two data sets on the same bar chart.
Is it self-marking? Yes, instant feedback throughout.
| Year Group | Year 6 Maths |
|---|---|
| Resource Type | 🎓 Interactive Lesson & Activities |
| Format | Digital Only |
| Curriculum | England & Wales — KS2 (Year 6) |
| Added | 4 March 2026 |
Membership unlocks this resource plus every lesson, worksheet and activity — all subjects, all year groups, all in one place.

Reviews
There are no reviews yet.