One-time purchase. Instant digital download.
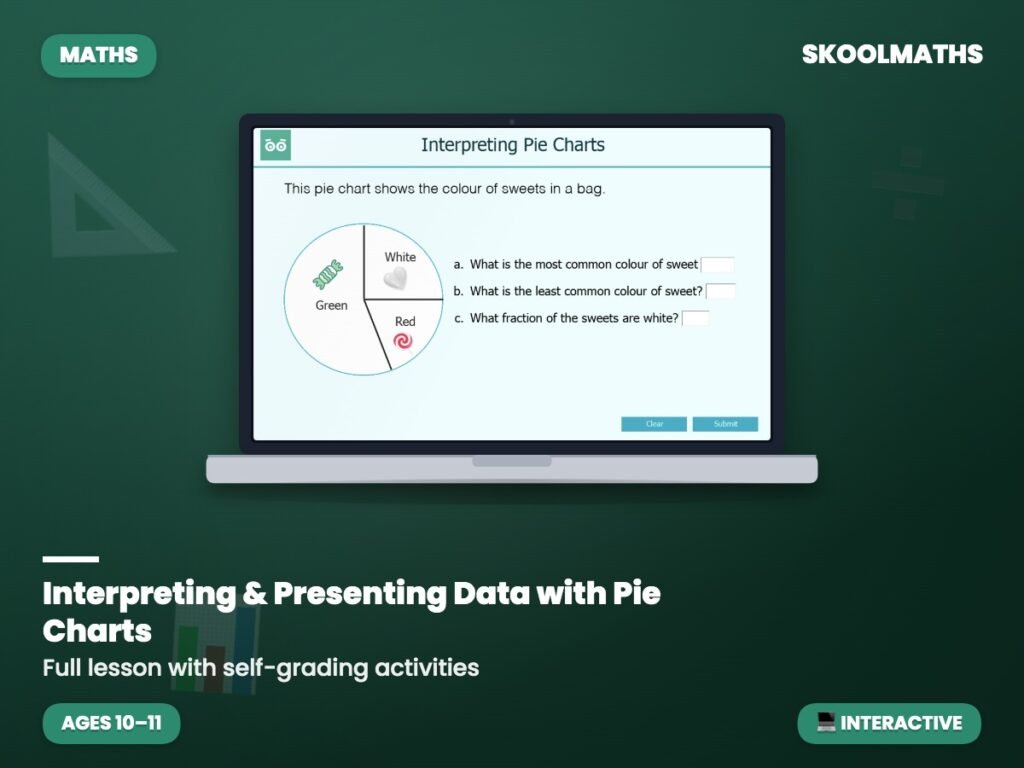
How many children chose blue? This 38-slide interactive lesson teaches Year 6 pupils to read and interpret pie charts using fractions.
Pupils learn to analyse and interpret data from pie charts and to compare different sections. They use fractions of the whole, so half of 40 children is 20 and a quarter is 10, and they remember that a complete circle represents the total. Real-life examples include favourite colours, sweets in a bag, hair colour, languages studied, TV programmes and how much Mrs Yusuf spent at a superstore, with problem-solving questions on finding totals.
A dependable addition to a Year 6 statistics topic, giving pupils plenty of practice in familiar contexts. Reading them confidently supports later work on constructing them and comparing data.
Build confident data skills today — Add to Basket.
What year group is this for? Year 6 (ages 10–11), KS2.
Does it teach constructing pie charts? No — this lesson focuses on interpreting them.
Is it self-marking? Yes, with instant feedback on the questions.
| Year Group | Year 6 Maths |
|---|---|
| Resource Type | 🎓 Interactive Lesson & Activities |
| Format | Digital Only |
| Curriculum | England & Wales — KS2 (Year 6) |
| Added | 22 April 2019 |
Membership unlocks this resource plus every lesson, worksheet and activity — all subjects, all year groups, all in one place.

Reviews
There are no reviews yet.