One-time purchase. Instant digital download.
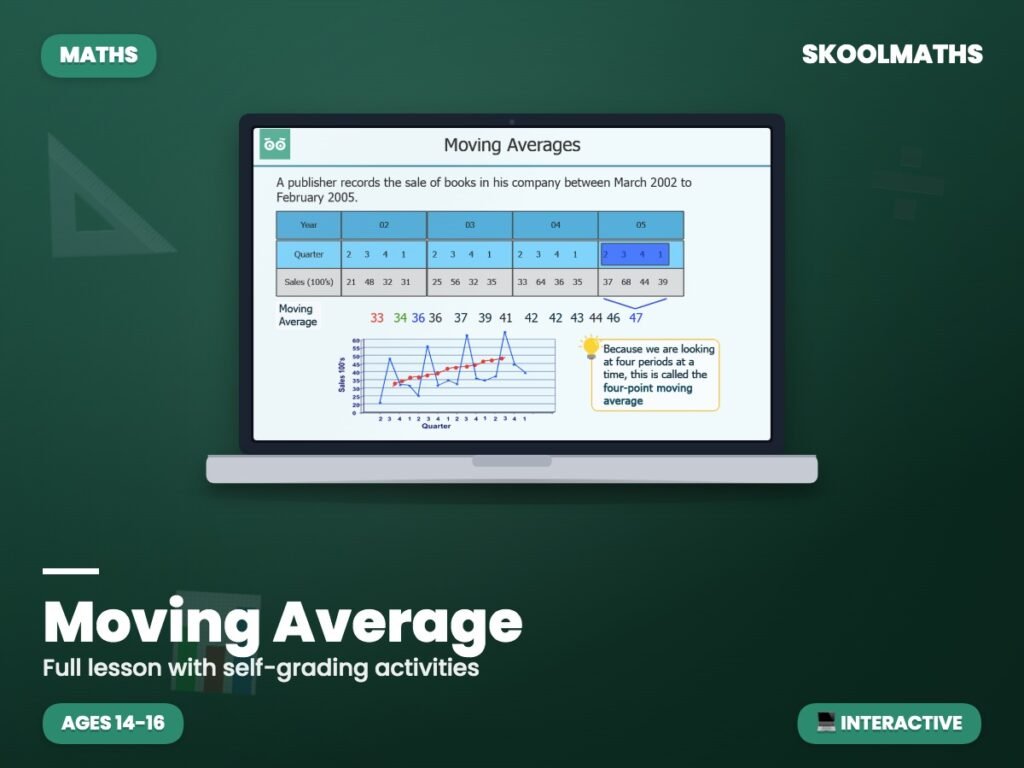
Want pupils genuinely understanding why a moving average smooths out fluctuating data, not just calculating one? This 15-slide interactive lesson gives pupils focused, self-marking practice calculating and interpreting moving averages.
Pupils practise calculating moving averages and interpreting what they reveal about a trend, building the fluency within the GCSE Maths curriculum’s statistics strand. Understanding why a moving average smooths out short-term fluctuations, not just how to calculate one, is exactly the conceptual understanding exam questions increasingly test.
A useful addition to any GCSE statistics topic, whether taught as the main lesson or used for focused revision closer to an exam covering trends and data interpretation. Recognising a genuine underlying trend behind noisy, fluctuating data is a skill that carries well beyond this single topic.
Build confident data-analysis skills today — Add to Basket.
What year groups is this for? GCSE (Years 10–11, ages 14–16).
Does it cover interpreting trends as well as calculating? Yes, both are covered throughout the lesson.
Is it self-marking? Yes, instant feedback throughout.
| Year Groups | Year 10–11 |
|---|---|
| Resource Type | 🎓 Interactive Lesson & Activities |
| Format | Digital Only |
| Curriculum | England & Wales — KS4 (Years 10–11) |
| Added | 4 March 2026 |
Membership unlocks this resource plus every lesson, worksheet and activity — all subjects, all year groups, all in one place.


Reviews
There are no reviews yet.